Where the world is losing its trees
- Forest in 2000
- 4000 million ha
- Forest lost since 2001
- 543 million ha
- 14% of it, about 5,400,000 km²
- Cleared for good
- 184 million ha
- deforestation, 34% of the loss
- Worst year
- 2016
- 29.7 million ha lost
Since 2001, the world has lost about 543 million hectares of forest (about 5,400,000 km²): 14% of the forest it had in 2000. The biggest cause was farms, pasture and plantations (32%). About 184 million hectares (34%) was deforestation: forest cleared for good for farms, mines or towns. Forest loss has stayed about the same: about 26.3 million hectares a year in 2021–2025, against 26.8 million hectares a year in 2016–2020.
Where the world has lost forest since 2001
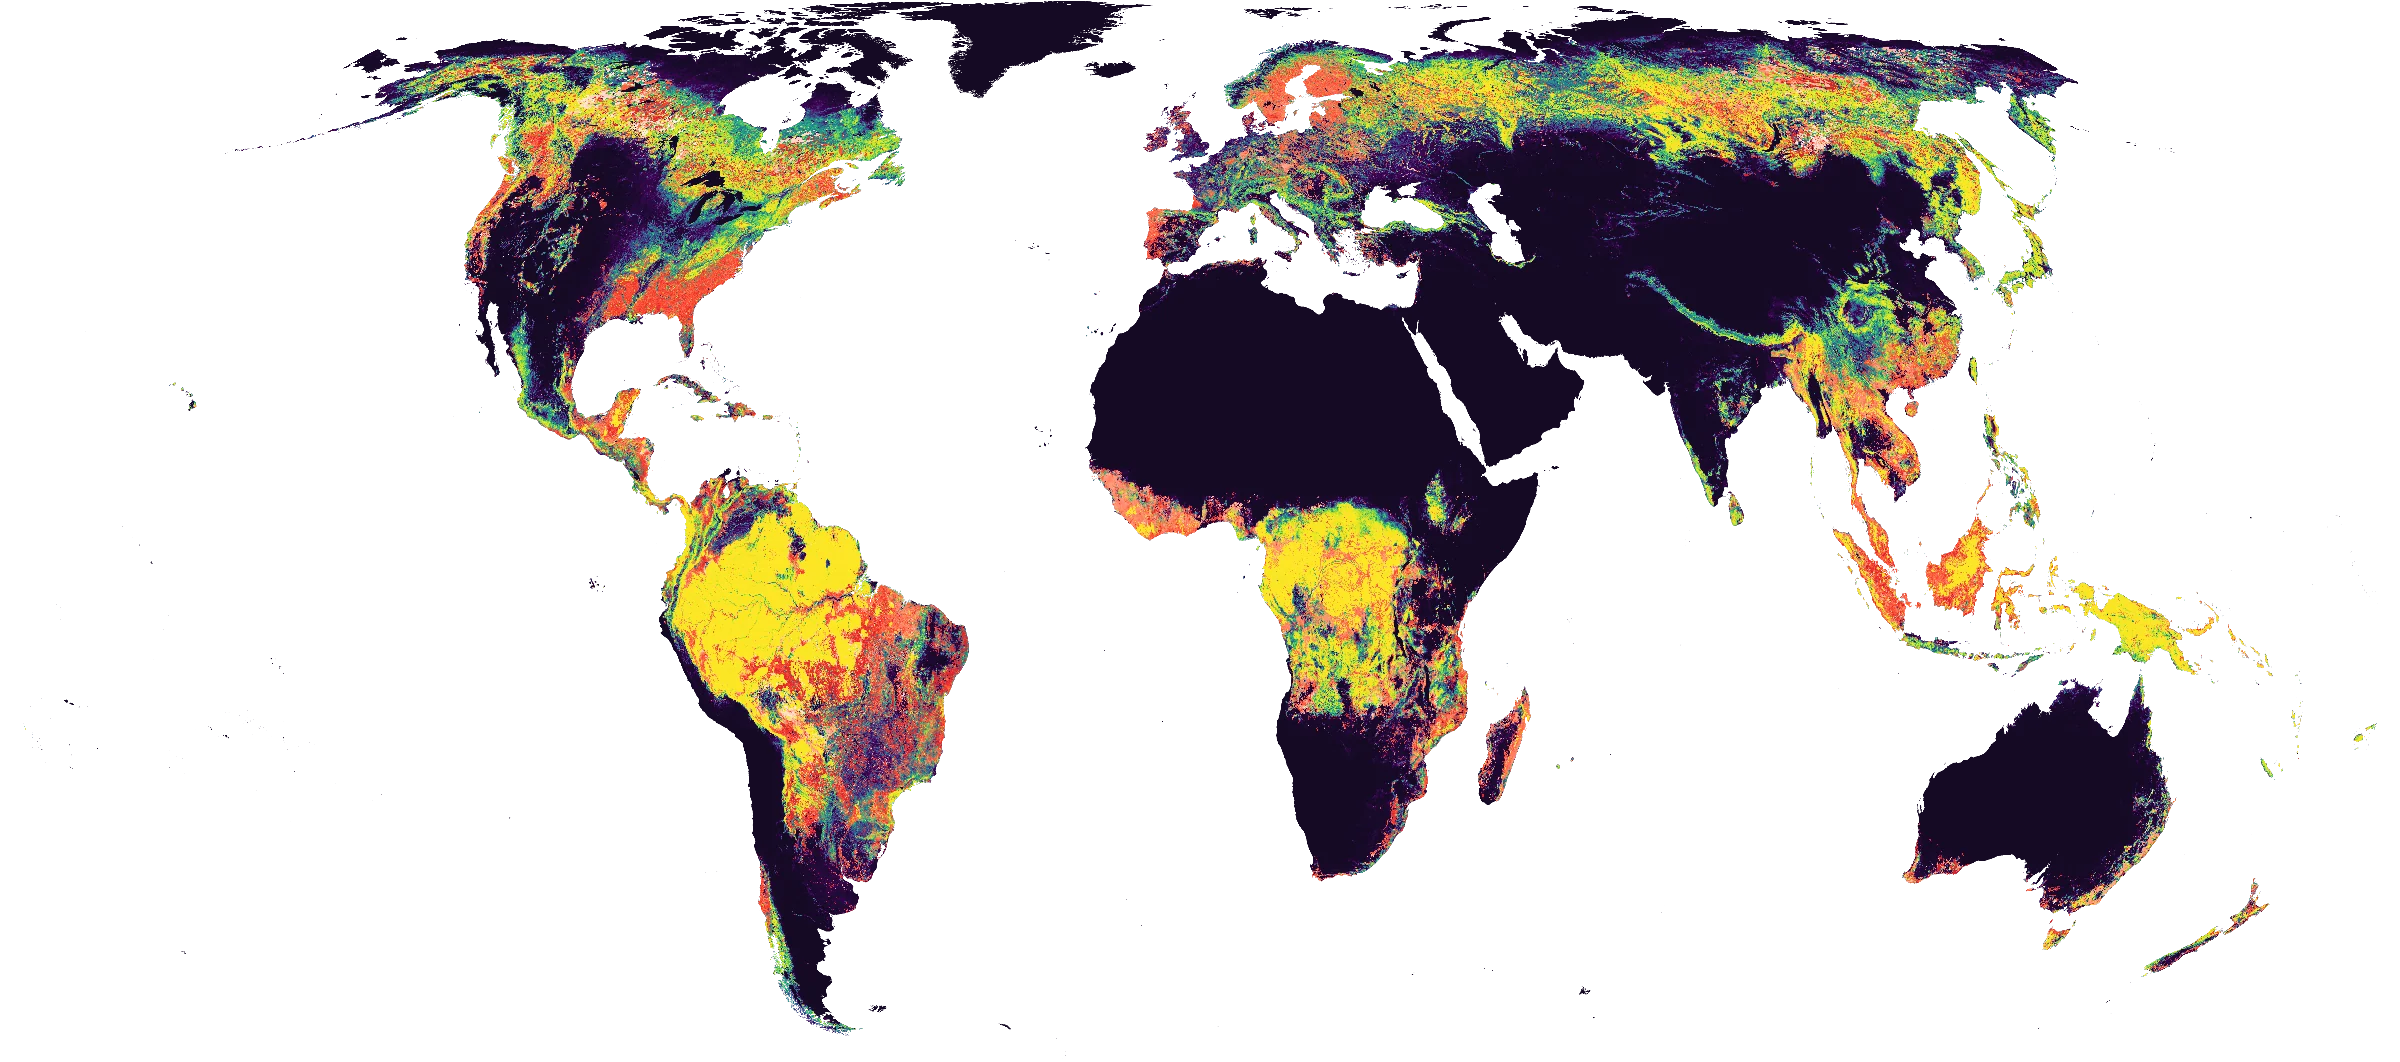
- Forest cover in 2000
- 0%25%50%75%100%How much of the land was forest: dark purple had little or none, yellow was dense forest.
- Year the forest was lost
- 200120132025Where forest was cut down, burned or cleared since 2001: red for the early years, through orange, to white for the most recent. Solid where a fifth or more of a place's forest went, fainter where 8% or more did.
Forest lost worldwide, year by year
The worst year was 2016, when about 29.7 million hectares of forest were lost.
Hectares of forest lost each year
Show the figures as a table
| Year | Cleared for good | Can grow back | Total |
|---|---|---|---|
| 2001 | 5.52 million ha | 7.84 million ha | 13.4 million ha |
| 2002 | 6.38 million ha | 10.1 million ha | 16.5 million ha |
| 2003 | 5.64 million ha | 8.85 million ha | 14.5 million ha |
| 2004 | 7.52 million ha | 12.4 million ha | 19.9 million ha |
| 2005 | 7.45 million ha | 10.7 million ha | 18.1 million ha |
| 2006 | 6.83 million ha | 10.8 million ha | 17.7 million ha |
| 2007 | 7.28 million ha | 11.1 million ha | 18.4 million ha |
| 2008 | 7.38 million ha | 11.2 million ha | 18.6 million ha |
| 2009 | 7.59 million ha | 9.42 million ha | 17 million ha |
| 2010 | 7.77 million ha | 10.8 million ha | 18.6 million ha |
| 2011 | 7.02 million ha | 10.6 million ha | 17.6 million ha |
| 2012 | 8.91 million ha | 14.6 million ha | 23.5 million ha |
| 2013 | 6.14 million ha | 14.5 million ha | 20.7 million ha |
| 2014 | 8.38 million ha | 15.4 million ha | 23.8 million ha |
| 2015 | 6.42 million ha | 13.2 million ha | 19.7 million ha |
| 2016 | 9.76 million ha | 20 million ha | 29.7 million ha |
| 2017 | 9.86 million ha | 19.6 million ha | 29.4 million ha |
| 2018 | 7.87 million ha | 16.9 million ha | 24.8 million ha |
| 2019 | 7.31 million ha | 16.9 million ha | 24.2 million ha |
| 2020 | 7.35 million ha | 18.5 million ha | 25.8 million ha |
| 2021 | 7.11 million ha | 18.2 million ha | 25.3 million ha |
| 2022 | 7.44 million ha | 15.4 million ha | 22.8 million ha |
| 2023 | 7.72 million ha | 20.6 million ha | 28.3 million ha |
| 2024 | 7.21 million ha | 22.4 million ha | 29.6 million ha |
| 2025 | 6.08 million ha | 19.5 million ha | 25.6 million ha |
Most deforested countries
US statesFull ranking| Country | Cleared for good | Share of its forest |
|---|---|---|
| Brazil | 56.2 million ha | 11% |
| Indonesia | 25 million ha | 16% |
| Malaysia | 7.55 million ha | 26% |
| Paraguay | 6.78 million ha | 28% |
| Bolivia | 5.81 million ha | 8.9% |
| Argentina | 5.72 million ha | 15% |
| Colombia | 5.2 million ha | 6.3% |
| Mexico | 4.39 million ha | 8.2% |
| Ivory Coast | 4.08 million ha | 27% |
| United States | 4 million ha | 1.4% |
Most deforested cities
Full ranking| City (10 km) | Cleared for good | Share of its forest |
|---|---|---|
| Subulussalam, Indonesia | 19,500 ha | 69% |
| Kluang, Malaysia | 18,200 ha | 77% |
| Kakata, Liberia | 16,300 ha | 56% |
| Ijok, Malaysia | 15,900 ha | 63% |
| Prabumulih, Indonesia | 15,700 ha | 57% |
| Pangkalanbuun, Indonesia | 14,700 ha | 59% |
| Sepang, Malaysia | 14,500 ha | 70% |
| Baturaja, Indonesia | 13,900 ha | 52% |
| Bandar Tasik Puteri, Malaysia | 13,200 ha | 61% |
| Maran, Malaysia | 12,200 ha | 47% |
What is causing deforestation worldwide?
- Farms, pasture and plantations32% · 174 million ha
Cleared for good. Forest cleared for crops, cattle pasture or tree plantations: the biggest cause of deforestation in the world.
- Wildfires29% · 155 million ha
Can grow back. Forest burned. It often grows back, though fire is sometimes used to clear land for good.
- Logging25% · 136 million ha
Can grow back. Trees cut for timber or paper. The land usually stays forest and grows back.
- Shifting farming9.5% · 51.6 million ha
Can grow back. Small patches cleared to grow crops for a few seasons, then left to grow back.
- Storms, floods and other natural causes1.6% · 8.59 million ha
Can grow back. Trees killed by storms, floods, landslides, pests or disease.
- Unknown causes1.5% · 8.24 million ha
Cause unknown. The satellites saw the trees go, but not why.
Also, each under 1%: mining and energy, towns and roads.
Causes for 2025 are estimates, based on what caused forest loss in the same places up to 2024.
Deforestation by country
Africa
- Algeria
- Angola
- Benin
- Burundi
- Cameroon
- Central African Republic
- Chad
- Comoros
- Democratic Republic of the Congo
- Egypt
- Equatorial Guinea
- Eswatini
- Ethiopia
- Gabon
- Ghana
- Guinea
- Guinea-Bissau
- Ivory Coast
- Kenya
- Liberia
- Madagascar
- Malawi
- Mali
- Mauritius
- Mayotte
- Morocco
- Mozambique
- Nigeria
- Republic of the Congo
- Reunion
- Rwanda
- Senegal
- Sierra Leone
- Somalia
- South Africa
- South Sudan
- Sudan
- Tanzania
- Togo
- Tunisia
- Uganda
- Zambia
- Zimbabwe
Asia
Europe
- Aland Islands
- Albania
- Austria
- Belarus
- Belgium
- Bosnia and Herzegovina
- Bulgaria
- Croatia
- Cyprus
- Czechia
- Denmark
- Estonia
- Finland
- France
- Germany
- Greece
- Hungary
- Ireland
- Italy
- Kosovo
- Latvia
- Lithuania
- Luxembourg
- Moldova
- Montenegro
- North Macedonia
- Norway
- Poland
- Portugal
- Romania
- Russia
- Serbia
- Slovakia
- Slovenia
- Spain
- Svalbard and Jan Mayen
- Sweden
- Switzerland
- The Netherlands
- Ukraine
- United Kingdom
North America
South America
Satellite timelapses by city
134 cities losing forest fast, each with a satellite photo a year since 2017, the forest lost marked on it, and its figures.
Africa
- Addis Ababa, Ethiopia
- Bangui, Central African Republic
- Benin City, Nigeria
- Bissau, Guinea-Bissau
- Brazzaville, Republic of the Congo
- Cape Town, South Africa
- Douala, Cameroon
- Freetown, Sierra Leone
- Gqeberha, South Africa
- Ibadan, Nigeria
- Kakamega, Kenya
- Kampala, Uganda
- Kananga, Democratic Republic of the Congo
- Kisangani, Democratic Republic of the Congo
- Kumasi, Ghana
- Mamoudzou, Mayotte
- Mbabane, Eswatini
- Mombasa, Kenya
- Nairobi, Kenya
- Yamoussoukro, Ivory Coast
- Yaoundé, Cameroon
Asia
- Bandar Seri Begawan, Brunei
- Batam, Indonesia
- Biên Hòa, Vietnam
- Bijie, China
- Budta, Philippines
- Bursa, Turkey
- Chaozhou, China
- Da Nang, Vietnam
- Davao, Philippines
- Dazhou, China
- Fushun, China
- Fuzhou, China
- Guankou, China
- Guigang, China
- Guilin, China
- Guiyang, China
- Heshan, China
- Hiroshima, Japan
- Huế, Vietnam
- Huizhou, China
- İzmir, Turkey
- Jambi City, Indonesia
- Jiangmen, China
- Jiujiang, China
- Kuala Lumpur, Malaysia
- Lianjiang, China
- Liuzhou, China
- Meishan, China
- Nanning, China
- Palangkaraya, Indonesia
- Palembang, Indonesia
- Pekanbaru, Indonesia
- Pontianak, Indonesia
- Puning, China
- Putian, China
- Puyang, China
- Qingyuan, China
- Qinzhou, China
- Quanzhou, China
- Sendai, Japan
- Shangrao, China
- Shenzhen, China
- Shiyan, China
- Singapore, Singapore
- Suwon, South Korea
- Thimphu, Bhutan
- Ulan Bator, Mongolia
- Ulsan, South Korea
- Yangjiang, China
- Yunfu, China
- Zhaoqing, China
- Zhuhai, China
- Zhuzhou, China
Europe
- Belgrade, Serbia
- Bern, Switzerland
- Helsinki, Finland
- Luxembourg, Luxembourg
- Madrid, Spain
- Mariehamn, Aland Islands
- Munich, Germany
- Oslo, Norway
- Pristina, Kosovo
- Riga, Latvia
- Saint Petersburg, Russia
- Sarajevo, Bosnia and Herzegovina
- Stockholm, Sweden
- Tallinn, Estonia
- Tirana, Albania
- Ufa, Russia
- Vilnius, Lithuania
- Yekaterinburg, Russia
North America
- Belmopan, Belize
- Castries, Saint Lucia
- Fort-de-France, Martinique
- Guatemala City, Guatemala
- Kingston, Jamaica
- Mérida, Mexico
- Nassau, Bahamas
- Ottawa, Canada
- Panama City, Panama
- Port of Spain, Trinidad and Tobago
- Roseau, Dominica
- Saint George's, Grenada
- Saint John’s, Antigua and Barbuda
- San José, Costa Rica
- San Salvador, El Salvador
- Santiago de los Caballeros, Dominican Republic
- Santo Domingo, Dominican Republic
- Tegucigalpa, Honduras
South America
- Asunción, Paraguay
- Barranquilla, Colombia
- Belém, Brazil
- Cayenne, French Guiana
- Ciudad del Este, Paraguay
- Cuiabá, Brazil
- Curitiba, Brazil
- Georgetown, Guyana
- Guarulhos, Brazil
- Iquitos, Peru
- Manaus, Brazil
- Marabá, Brazil
- Medellín, Colombia
- Paramaribo, Suriname
- Porto Velho, Brazil
- Pucallpa, Peru
- Quito, Ecuador
- Rio Branco, Brazil
- Santa Cruz de la Sierra, Bolivia
- Santarém, Brazil
- Valencia, Venezuela
Oceania
- Canberra, Australia
- Honiara, Solomon Islands
- Wellington, New Zealand
Find a city or country
Every city and country we track shows how much forest it has lost since 2001; the places losing the most have a page of their own.
Frequently asked
Questions about deforestation
How much forest has the world lost since 2001?
Since 2001, the world has lost about 543 million hectares of forest (about 5,400,000 km²): 14% of the forest it had in 2000. The biggest cause was farms, pasture and plantations (32%). About 184 million hectares (34%) was deforestation: forest cleared for good for farms, mines or towns.
Is deforestation worldwide getting worse?
Forest loss has stayed about the same: about 26.3 million hectares a year in 2021–2025, against 26.8 million hectares a year in 2016–2020. These are five-year averages from 2011 on, the years the satellite maps were all made the same way.
What is causing deforestation worldwide?
The main causes of forest loss since 2001 are farms, pasture and plantations (32%), wildfires (29%), logging (25%). About 184 million hectares was deforestation, meaning forest cleared for good for farms, mines or towns. Causes for 2025 are estimates, based on what caused forest loss in the same places up to 2024.
What was the worst year for forest loss worldwide?
The worst year was 2016, when about 29.7 million hectares of forest were lost.
How is forest loss measured?
We use satellite maps from the University of Maryland (Hansen and colleagues) that show, for every 30 × 30 m patch of land on Earth, the year its trees were cut down, burned or died, from 2001 to 2025. We add up those patches worldwide, counting only places that were at least 30% covered by trees in 2000. The cause of each loss comes from a map made by the World Resources Institute and Google DeepMind. All figures are estimates.
Which country has lost the most forest?
Brazil has cleared the most forest for good since 2001: about 56.2 million ha, 11% of the forest it had in 2000. Counting all forest lost, burned and logged forest that can grow back included, Russia lost the most: about 91.7 million ha. The ranking of every country is linked below.
Which city has lost the most forest?
Around Subulussalam, Indonesia, about 19,500 ha of forest within 10 km of the centre was cleared for good from 2001 to 2025, more than around any other city we track.
How these figures are made
Forest lost. Scientists at the University of Maryland (Hansen and colleagues) use satellite images to map, for every 30 × 30 m patch of land on Earth, the year its trees were cut down, burned or died, from 2001 to 2025. We add those patches up for each country, region and city. Only places at least 30% covered by trees in 2000 count, the same rule Global Forest Watch uses, so our figures can be checked against theirs.
Deforestation means forest cleared for good: for farms, pasture and plantations, for mines, or for towns and roads. A map by the World Resources Institute and Google DeepMind gives the main cause in each square kilometre. Logging, fire, storms and shifting farming count as forest lost but not as deforestation, because the forest usually grows back. The causes map runs to 2024; later years take the cause each place had before, so they are estimates.
Cities are measured over everything within 10 km of the city centre, because centres are built up and forest is usually lost at a city's edges. Countries and regions use Natural Earth's boundaries, and every patch counts for its true area.
Forest gained. The loss maps can't see trees growing, so forest gained comes from a second University of Maryland map (Potapov and colleagues) that compares where forest stood in 2000 and 2020, plantations and orchards included.
Limits. All figures are estimates from satellite maps, so we round them. The satellite method improved in 2011, so trends compare five-year averages from 2011 on, not with the 2000s.
Satellite timelapses are photos from the European Space Agency's Sentinel-2 satellites: one clear image a year from 2017, taken in the same season each year so the colours compare.
Sources and reuse. Hansen, M. C. et al. (2013), Science 342, 850–853 (CC BY 4.0, “Source: Hansen/UMD/Google/USGS/NASA”); Sims, M. J. et al. (2025), Environmental Research Letters 20, 074027 (CC BY 4.0); Potapov, P. et al. (2022), Frontiers in Remote Sensing 3, 856903 (CC BY 4.0); Natural Earth (public domain); contains modified Copernicus Sentinel data. Airleaf's figures and images may be reused under CC BY 4.0 with credit to Airleaf and the sources above.
Download the country figures (CSV)