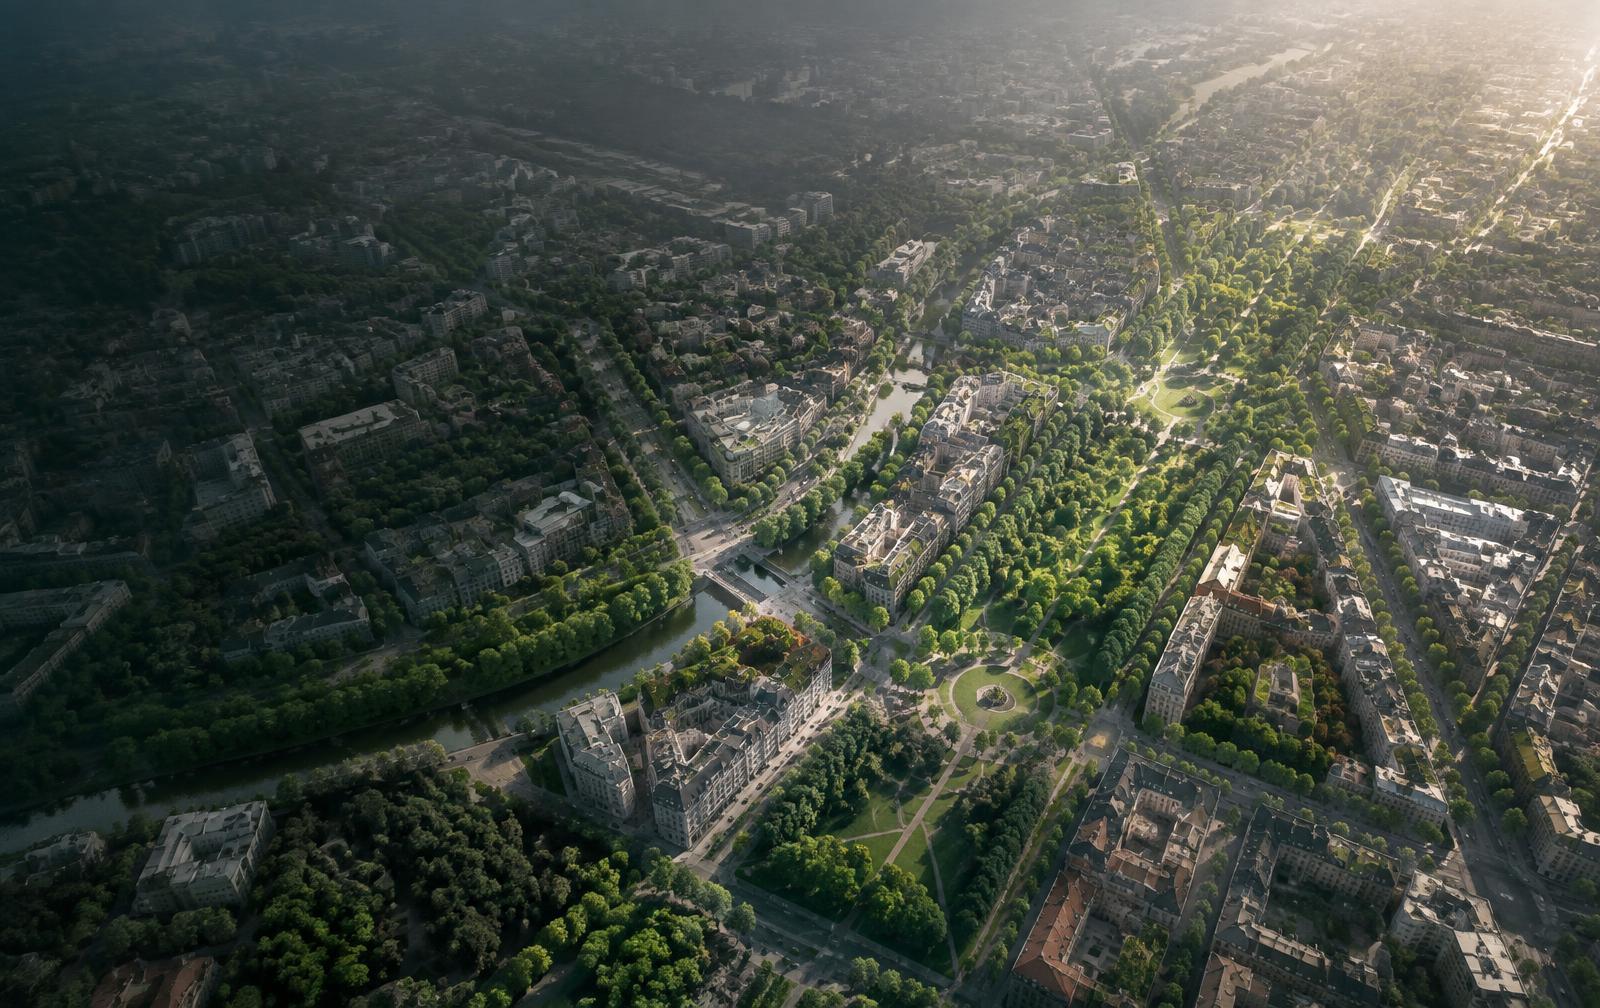
City report · Pakistan · Punjab
Sargodha
Measured across a 2 km radius around Sargodha, Pakistan (12.57 km²)
- Tree cover
- 23.0%
- Air quality
- 99Moderate
- Trees in this area
- 72.3K
- More trees needed
- 22.0K
- Area analyzed
- 12.57 km²
- Satellite image
- Sep 26, 2026
Sargodha's tree count comes to 72,257 trees across 12.57 km² — 7 points below the 30% tree-cover level considered healthy for this area, meaning roughly 21,991 more trees would close the gap. Air quality currently reads AQI 99 (Moderate): Unusually sensitive people should consider limiting long outdoor exertion.
Tree cover detail
Below target
23.0% tree cover against a 30% healthy-neighborhood target, across 12.57 km².
Trees in this area
72,257
Target trees
94,248
More trees needed
21,991
CO₂ if planted / yr
483.8 t
Air quality detail
AQI 99Moderate
Observed Sep 27, 09:00 local time via Open-Meteo / CAMS, US EPA index. Values in µg/m³.
Health signal
Unusually sensitive people should consider limiting long outdoor exertion.
PM2.5
35.0
PM10
36.4
NO₂
16.3
O₃
116.0
SO₂
8.1
CO
604.0
Frequently asked
Questions about Sargodha
What is the tree count in Sargodha?
Sargodha has an estimated 72,257 trees across the 12.57 km² measured — 23.0% tree cover, 7 percentage points short of the 30% tree-cover target set for this area.
How many more trees does Sargodha need?
Sargodha needs roughly 21,991 more trees to close a 7-point shortfall against its 30% tree-cover target — about 483.8 t of extra CO₂ absorbed per year once grown.
What is the air quality (AQI) in Sargodha right now?
The latest reading for Sargodha shows an AQI of 99 (Moderate), observed Sep 27, 09:00 local time via Open-Meteo / CAMS, US EPA index. Unusually sensitive people should consider limiting long outdoor exertion.
How is Sargodha's tree cover and air quality measured?
Tree cover is measured from Sentinel-2 L2A (ESA Copernicus) via Earth Search satellite imagery at 10 m detail across a 2 km radius around Sargodha; the tree count is an estimate derived from that cover. Air-quality readings come from Open-Meteo / CAMS, US EPA index and may differ from street-level monitors.
See your own area
What does your neighborhood look like?
Pick any point and radius to get the same tree-cover and air-quality breakdown.
Check my address