City report · Pakistan
Islamabad Air quality today
Air quality in Islamabad currently reads AQI 176 (Unhealthy): Everyone should limit long outdoor exertion; sensitive groups more so.
Air quality right now
AQI 176
Unhealthy
- PM2.5, fine particles (µg/m³)
- 90.6
- tree cover
- 50.2%
- trees in this area
- 158K
- more trees needed
- 0
Measured across a 2 km radius around F-8/3 F 8/3 F-8, Islamabad, Pakistan (12.57 km²), from a satellite image of Sep 11, 2026. Lower AQI is better: 0–50 is Good, above 300 is Hazardous.
Islamabad · AQI 176 (Unhealthy)
Islamabad's tree count comes to 157,708 trees across 12.57 km², already at or above the 40% tree-cover level considered healthy for this area.
Air quality detail
Air quality in Islamabad today: AQI 176, Unhealthy
Main pollutant: PM2.5 · Observed Nov 11, 19:00 local time via OpenAQ ground stations, US EPA index. Values in µg/m³.
Ground station · F-7, Islamabad, 1.2 km away · median of 11 stations
Health signal
Everyone should limit long outdoor exertion; sensitive groups more so.
PM2.5
90.6
PM10
—
NO₂
—
O₃
—
SO₂
—
CO
—
Data: OpenAQ · AirGradient, Hawanama, Homer Simpson, Pakistan Air Quality Initiative (PAQI پاکی), The Urban Unit
- Outdoor exercise
- Everyone should cut down long or hard exercise; sensitive groups should avoid it
- Windows
- Keep them closed
- Mask
- Wear an N95 outdoors
- Air purifier
- Run one
Over the last 7 days, the CAMS air-quality model put Islamabad's daily AQI at 105 on average, from 84 on Nov 11 to an hourly peak of 178 on Nov 9.
Where Islamabad stands: the most polluted cities in the world right now · the cleanest
City air guide
Why does Islamabad get smog in winter?
Right now
- Today's AQI in Islamabad is 176, unhealthy, mostly from PM2.5.
- Over the past 7 days, the daily average was 105.
- November is in Islamabad's usual season for winter smog (October to January), so expect bad days to come and go until it ends.
Islamabad's air carries fine particles all year, and they build up into smog in winter. In a report covered by Dawn in December 2025, Islamabad's yearly average of PM2.5, the tiny particles that do most harm, was 52.3 µg/m³, about 10 times the WHO guideline [1][8]. Traffic is the biggest source in the region, followed by brick kilns and waste burning [1]. In winter, a temperature inversion and fog trap this pollution near the ground [2][4]. December 2024 was the city's most polluted month on record since 2018 [2].
Why does the smog come every winter?
Smog is a haze of smoke, dust and harmful gases from factories, vehicles and other sources that mixes with winter fog and moisture [4]. In winter, a temperature inversion, a layer of warmer air sitting over cooler air near the ground, can trap this haze close to the ground [4]. In January 2025, Dawn reported that inversion and fog leave the capital hazy in winter [2].
In a Pakistan Air Quality Initiative report covered by Dawn in December 2025, pollution across the Islamabad and Rawalpindi area in the 2023 to 2024 winter rose to more than four times the monsoon average [1]. The report blamed stagnant winds, more vehicle use and widespread burning of waste [1]. A 2026 Express Tribune report on the twin cities gives the smog season as October 15 to January 15 [4].
Where does Islamabad's pollution come from?
PM2.5 is fine particulate matter, the type of air pollution considered most harmful to people, because it can be breathed deep into the lungs and bloodstream [11]. By the emissions inventory in the Pakistan Air Quality Initiative's report, covered in December 2025, transport makes 53% of the PM2.5 released in the Islamabad and Rawalpindi area [1]. Brick kilns add 18%, waste burning 11% and industry 9% [1].
In January 2025, Dawn reported that over a million vehicles had been registered with Islamabad's Excise and Taxation Department in the previous decade, and at least 500,000 more routinely enter the city [2]. It also named construction, garbage or compost burning and pollution from across the city's borders [2]. In November 2024, Dawn reported that pollution from neighbouring Rawalpindi was adding to Islamabad's PM2.5 levels [3].
In October 2025, the director general of Pak-EPA, the federal environment agency, named fine dust from marble cutting and polishing among the causes of air pollution in the smog season [6].
How bad does it get?
The Pakistan Air Quality Initiative's report found that Islamabad went over Pakistan's legal pollution limits on 168 days in 2024, against 199 days in Rawalpindi [1]. It estimated that long-term exposure costs Islamabad residents 4.1 years of life expectancy [1].
On a Friday in November 2024, Pak-EPA measured PM2.5 at 186 µg/m³ over Islamabad, more than five times the national limit of 35 µg/m³ [3]. Pak-EPA data showed five very unhealthy days in December 2024 and two in November [2]. On December 22, 2024, PM2.5 went above 200 µg/m³ [2].
Across the country, IQAir's 2025 report ranked Pakistan the most polluted country of the year, with PM2.5 up to 13 times the WHO level of less than 5 µg/m³ [8].
What is being done about it?
In October 2025, Pak-EPA and the city administration demolished brick kilns in sectors H-16 and H-17 that kept running after an October 20 deadline to switch to zigzag technology, a cleaner kiln design [5]. The same month, Pak-EPA sealed polluting marble factories near sector B-17 [6]. By December 2025, Pak-EPA said all 30 brick kilns in the capital used zigzag technology [7].
From December 1, 2025, more than 1,000 diesel vehicles were inspected at Islamabad's entry points, and more than 80 were impounded for breaking emission and noise standards [7]. Four new emission testing stations were set up in the city [7]. Longer-term plans named in December 2025 include the Electric Vehicle Policy 2025, phasing out old vehicles and working with the provinces on smog that crosses their borders [7].
How to protect yourself in Islamabad
On days when the air is poor, spend less time being active outdoors, and be active when the air quality is better [9]. People in sensitive groups are advised to cut back on long or heavy exertion [9]. Plan walks, runs and bike rides on routes away from busy roads, and set your car's ventilation to recirculate on busy roads [9].
Keeping windows and doors shut, with air conditioning, can cut how much particle pollution gets indoors when outdoor levels are high [10]. Indoor HEPA air filters have also been shown to lower particle levels indoors [10].
Our picks for Islamabad's air
Air purifiers for smoke and smog
ranked by how much smoke they clear, with the room size each one can handle
See the guideFor days you have to go out
N95 masks that fit
certified masks, and how to get a seal
See the masksBuying in Pakistan
The best air purifiers in Pakistan for smog season
sold on Daraz, with prices in rupees and the room size each one can really handle
See the guideSources
- [1] Dawn, Twin cities facing severe air pollution crisis, warns report (on the Pakistan Air Quality Initiative's report) (December 2025)
- [2] Dawn, December 2024 most polluted month in capital's history (January 2025)
- [3] Dawn, Government advises precautions as air quality worsens in capital (November 2024)
- [4] The Express Tribune, Twin cities brace for smog (October 2026)
- [5] Ministry of Climate Change and Environmental Coordination, Pakistan, Pak-EPA, ICT jointly demolishes polluting brick kilns in Islamabad in anti-smog operation (October 2025)
- [6] Ministry of Climate Change and Environmental Coordination, Pakistan, Pak-EPA seals polluting marble factories in Islamabad in anti-smog crackdown (October 2025)
- [7] Dawn, Pak-EPA ramps up anti-smog crackdown as pollution worsens in Islamabad (December 2025)
- [8] Dawn (Reuters), Pakistan ranked most polluted country in 2025, data shows (March 2026)
- [9] US EPA, Patient Exposure and the Air Quality Index (May 2026)
- [10] US EPA, Frequent Questions about Particle Pollution (June 2026)
- [11] Dawn, Islamabad's air quality becomes 'very unhealthy': Pak-EPA (November 2024)
Last reviewed . The figures in the box at the top update with every new reading; the guide itself is checked against its sources at least once a year, before the city's bad-air season.
Tree cover detail
Tree cover in Islamabad: Healthy tree cover
50.2% tree cover against a 40% healthy-neighborhood target, across 12.57 km².
Trees in this area
157,708
Target trees
157,708
More trees needed
0
CO₂ if planted / yr
0 kg
Deforestation · 2001–2025
How much forest has Islamabad lost?
Since 2001, the area within 10 km of Islamabad has lost about 20 hectares of forest (about 28 football pitches): under 1% of the forest it had in 2000. The biggest cause was wildfires (26%), after which forest can grow back. About 6 hectares (28%) was deforestation: forest cleared for good for farms, mines or towns.
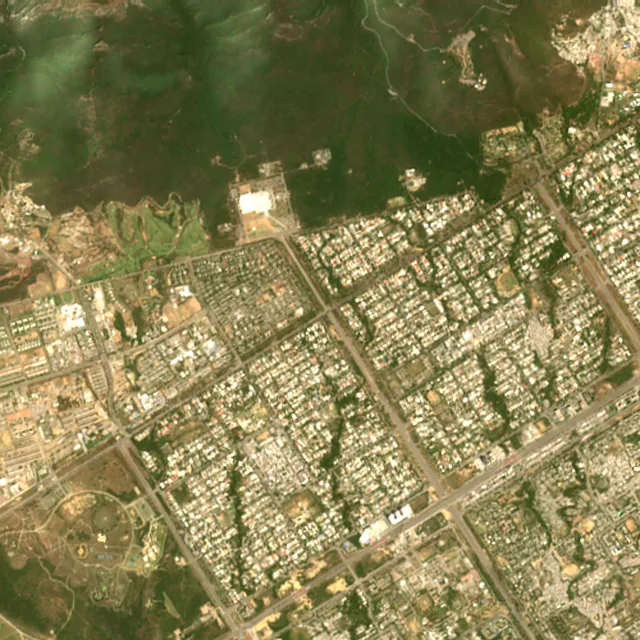
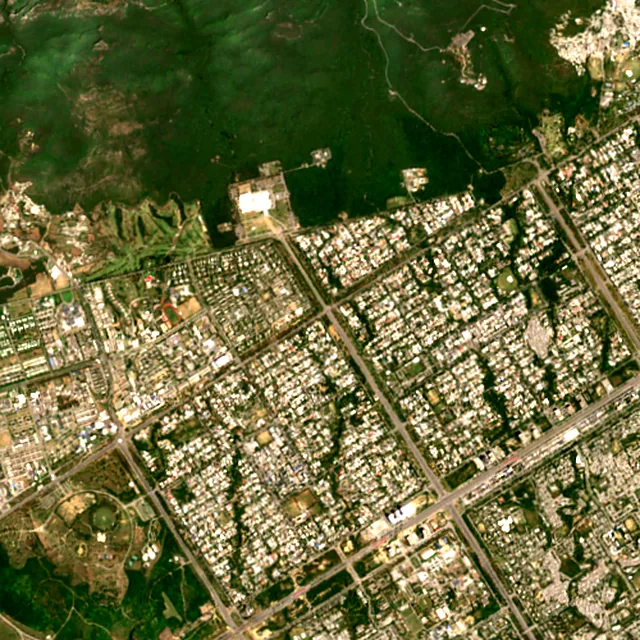

2017: satellite photo from June 2017 of a 5 × 5 km area in the city center.
- Forest lost since 2001
- 20 haabout 28 football pitches
- Share of its forest
- under 1%of what there was in 2000
- Cleared for good
- 6 hadeforestation: turned into farms, mines or towns
The worst year was 2009, when about 5 hectares of forest were lost, mostly to wildfires.
Hectares of forest lost each year
Show the figures as a table
| Year | Cleared for good | Can grow back | Total |
|---|---|---|---|
| 2001 | under 1 ha | under 1 ha | under 1 ha |
| 2002 | under 1 ha | 1 ha | 2 ha |
| 2003 | under 1 ha | under 1 ha | under 1 ha |
| 2004 | under 1 ha | under 1 ha | 1 ha |
| 2005 | under 1 ha | under 1 ha | under 1 ha |
| 2006 | 1 ha | 1 ha | 2 ha |
| 2007 | under 1 ha | under 1 ha | under 1 ha |
| 2008 | under 1 ha | under 1 ha | 1 ha |
| 2009 | 2 ha | 3 ha | 5 ha |
| 2010 | under 1 ha | 2 ha | 2 ha |
| 2011 | under 1 ha | under 1 ha | under 1 ha |
| 2012 | under 1 ha | 2 ha | 2 ha |
| 2013 | under 1 ha | under 1 ha | under 1 ha |
| 2014 | under 1 ha | under 1 ha | under 1 ha |
| 2015 | under 1 ha | under 1 ha | under 1 ha |
| 2016 | under 1 ha | under 1 ha | under 1 ha |
| 2017 | under 1 ha | under 1 ha | under 1 ha |
| 2018 | under 1 ha | under 1 ha | under 1 ha |
| 2019 | under 1 ha | under 1 ha | under 1 ha |
| 2020 | under 1 ha | under 1 ha | under 1 ha |
| 2021 | 1 ha | under 1 ha | 1 ha |
| 2022 | under 1 ha | under 1 ha | under 1 ha |
| 2023 | under 1 ha | under 1 ha | under 1 ha |
| 2024 | under 1 ha | 1 ha | 1 ha |
| 2025 | under 1 ha | 2 ha | 2 ha |
What is causing deforestation around Islamabad?
- Wildfirescan grow back26% · 5 ha
- Farms, pasture and plantationscleared for good17% · 3 ha
- Towns and roadscleared for good11% · 2 ha
Also: logging, unknown causes.
Causes for 2025 are estimates, based on what caused forest loss in the same places up to 2024.
Forest gained and lost, 2000–2020
- Forest in 2000
- 10,100 ha
- Forest in 2020
- 10,300 ha
- Overall change
- +211 hamore forest than in 2000
Comparing satellite maps from 2000 and 2020, the forest around Islamabad grew from about 10,100 hectares to 10,300 hectares, a net gain of about 211 hectares (+2.1%). New forest grew on about 322 hectares, while 111 hectares were lost.
These 2000 and 2020 maps, from the University of Maryland, count any land with trees taller than 5 m as forest, including plantations and orchards. Forest that was cut or burned and had grown back by 2020 counts in both years, so the loss here is smaller than the yearly figures.
These figures cover everything within 10 km of the city center, a wider area than the report above, because forest is usually lost at a city's edges.
Source: Hansen/UMD/Google/USGS/NASA, Global Forest Change (GFC-2025-v1.13); causes: WRI/Google DeepMind drivers of forest loss; both CC BY 4.0, summed by Airleaf for each area. Forest gained and lost 2000–2020: Potapov et al. 2022, UMD GLAD Global Land Cover and Land Use Change, CC BY 4.0. Images: contains modified Copernicus Sentinel data. How it's measured
In the same region
Measured cities near Islamabad
Same 2 km radius, same index — so they compare directly.
- Rawalpindi13.8 km
Pakistan
- Tree cover
- 14%
- Air quality
- 176
- Abbottabad49.7 km
Pakistan
- Tree cover
- 36%
- Air quality
- 167
- Dhirkot60.6 km
Pakistan
- Tree cover
- 78%
- Air quality
- 130
- Attock City63.4 km
Pakistan
- Tree cover
- 12%
- Air quality
- 160
- Tordher76.0 km
Pakistan
- Tree cover
- 14%
- Air quality
- 164
- Muzaffarābād82.2 km
Pakistan
- Tree cover
- 33%
- Air quality
- 82
Also compared:Islamabad vs LahoreIslamabad vs KarachiIslamabad vs PeshawarIslamabad vs Faisalabad
Build your own
Compare Islamabad with anywhere
This place
Islamabad
Use this data
Put Islamabad's numbers on your site
Free to embed. Updates itself as the measurement refreshes.
Frequently asked
Questions about Islamabad
What is the air quality (AQI) in Islamabad right now?
The latest reading for Islamabad shows an AQI of 176 (Unhealthy), measured Nov 11, 19:00 local time by 11 ground monitoring stations via OpenAQ (the median of their readings; the nearest is F-7, Islamabad, 1.2 km away). The main pollutant is PM2.5. Everyone should limit long outdoor exertion; sensitive groups more so.
Is it safe to exercise outside in Islamabad today?
At AQI 176 (Unhealthy): everyone should cut down long or hard exercise; sensitive groups should avoid it. Windows: keep them closed. Masks: wear an N95 outdoors. The reading changes through the day, so check again before a long run or ride.
What has the air quality in Islamabad been like this week?
Over the last 7 days, the CAMS air-quality model put Islamabad's daily AQI at 105 on average, from 84 on Nov 11 to an hourly peak of 178 on Nov 9. On 3 of those days the average was above 100, unhealthy for sensitive groups.
When is smog season in Islamabad?
A 2026 Express Tribune report gives the smog season in the twin cities as October 15 to January 15. December 2024 was Islamabad's most polluted month on record since 2018.
What is the main source of Islamabad's air pollution?
Transport. By an emissions inventory in a Pakistan Air Quality Initiative report covered in December 2025, transport makes 53% of the fine particles released in the Islamabad and Rawalpindi area, brick kilns 18%, waste burning 11% and industry 9%.
Is Islamabad's air cleaner than Rawalpindi's?
Somewhat. In the same report, Islamabad's yearly average fine particle level was 52.3 µg/m³ against 61.1 in Rawalpindi, and in 2024 Islamabad went over Pakistan's legal limits on 168 days against 199 in Rawalpindi.
Why does smog get trapped over Islamabad in winter?
In winter, a temperature inversion can hold a layer of polluted air near the ground, and fog and still winds keep it from clearing. More vehicle use and waste burning add to it.
How much forest has the area around Islamabad lost since 2001?
Since 2001, the area within 10 km of Islamabad has lost about 20 hectares of forest (about 28 football pitches): under 1% of the forest it had in 2000. The biggest cause was wildfires (26%), after which forest can grow back. About 6 hectares (28%) was deforestation: forest cleared for good for farms, mines or towns. Comparing satellite maps from 2000 and 2020, the forest around Islamabad grew from about 10,100 hectares to 10,300 hectares, a net gain of about 211 hectares (+2.1%). New forest grew on about 322 hectares, while 111 hectares were lost.
What is the tree count in Islamabad?
Islamabad has an estimated 157,708 trees across the 12.57 km² measured — 50.2% tree cover, already past the 40% tree-cover target set for this area.
How many more trees does Islamabad need?
Islamabad has already reached its tree-cover target, so no additional trees are needed to close the gap.
How are Islamabad's air quality and tree cover measured?
Air quality is measured by ground monitoring stations near F-8/3 F 8/3 F-8, via OpenAQ; the 7-day trend is the Open-Meteo / CAMS model's estimate. Tree cover is measured from Sentinel-2 L2A (ESA Copernicus) via Earth Search satellite imagery at 10 m detail across a 2 km radius around F-8/3 F 8/3 F-8; the tree count is an estimate derived from that cover.
See your own area
What does your neighborhood look like?
Pick any point and radius to get the same air-quality and tree-cover breakdown.
Check my address