City report · Punjab, Pakistan
Lahore Air quality today
Air quality in Lahore currently reads AQI 241 (Very unhealthy): Health alert — everyone should avoid long outdoor exertion.
Air quality right now
AQI 241
Very unhealthy
- PM2.5, fine particles (µg/m³)
- 166.0
- tree cover
- 32.4%
- trees in this area
- 102K
- more trees needed
- 39.6K
Measured across a 2 km radius around Block N Gulberg III, Lahore, Pakistan (12.57 km²), from a satellite image of Sep 8, 2026. Lower AQI is better: 0–50 is Good, above 300 is Hazardous.
Lahore · AQI 241 (Very unhealthy)
Lahore's tree count comes to 101,788 trees across 12.57 km², 13 points below the 45% tree-cover level considered healthy for this area, so roughly 39,584 more trees would close the gap.
Air quality detail
Air quality in Lahore today: AQI 241, Very unhealthy
Main pollutant: PM2.5 · Observed Nov 11, 18:00 local time via OpenAQ ground stations, US EPA index. Values in µg/m³.
Ground station · CERP Office, 700 m away · median of 37 stations
Health signal
Health alert — everyone should avoid long outdoor exertion.
PM2.5
166.0
PM10
—
NO₂
—
O₃
—
SO₂
—
CO
—
Data: OpenAQ · AirGradient, Hawanama, Pakistan Air Quality Initiative (PAQI پاکی), The Urban Unit
- Outdoor exercise
- Everyone should avoid long or hard exercise outdoors; sensitive groups, all outdoor exertion
- Windows
- Keep them closed
- Mask
- Wear an N95 if you go out
- Air purifier
- Run one on high
Over the last 7 days, the CAMS air-quality model put Lahore's daily AQI at 191 on average, from 135 on Nov 7 to an hourly peak of 374 on Nov 11.
Where Lahore stands: the most polluted cities in the world right now · the cleanest
City air guide
Why is Lahore's air so bad in winter?
Right now
- Today's AQI in Lahore is 241, very unhealthy, mostly from PM2.5.
- Over the past 7 days, the daily average was 191.
- November is in Lahore's usual season for smog (October to February), so expect bad days to come and go until it ends.
Lahore's air is polluted all year, but from October to February it gets much worse: fine particle levels averaged 124–183 µg/m³ a month through the 2025–26 smog season, against 40–59 µg/m³ in the spring and summer [1]. In winter the layer of air that dilutes the city's smoke shrinks to a fraction of its summer depth, just as crop burning around the rice harvest adds to it [1]. Pakistan was the most polluted country in the world in 2025, by IQAir's count [2].
Why does the smog come every winter?
Pollution near the ground mixes into the air above it, up to a height called the mixing layer. Over Lahore that layer is about 830–860 m deep in May and June, but it shrinks to about 400 m in October, 260 m in November and about 190 m in December, so the same smoke is packed into much less air [1].
Crop burning around the rice harvest comes at the same time, and the winds stay light all year, at about 2 m/s, so little blows the smog away [1].
Where does Lahore's pollution come from?
By the Punjab Urban Unit's emissions inventory, Lahore's fine particles (PM2.5) come from transport (about 35%), crop-residue burning (33%), waste burning (29%) and industry (3%), based on 2020–21 data [1].
You may see a figure of 83% for transport. That covers all pollutants by weight and is dominated by carbon monoxide; it isn't transport's share of the fine particles that make smog harmful [1].
How bad is it?
Among the worst anywhere. IQAir's 2025 report ranked Pakistan the most polluted country of the year, with fine particle levels up to 13 times the World Health Organization's guideline [2]. Lahore's monthly averages of 124–183 µg/m³ through the 2025–26 smog season compare with the WHO's annual guideline of 5 µg/m³ [1].
What is being done about it?
In the 2025 smog season, the Punjab government mobilised nine departments against smog: drones watch brick kilns, "smog guns" spray water mist at pollution hotspots, heavy trucks are restricted, and construction sites must cover their materials [3].
In November 2025, its anti-smog committee approved stopping the production of petrol-powered motorcycle rickshaws, a phased end to making petrol motorcycles, a ban on washing vehicles at home, and penalties for burning plastic and other materials that give off toxic smoke [4].
How to protect yourself in Lahore
From October to February, keep doors and windows shut on smoggy days and run a HEPA air purifier in the room where you sleep, sized for that room. Seal the gaps around windows if you can: smog gets in through every crack.
Outdoors, a well-fitted N95 mask cuts how much smog you breathe; cloth and surgical masks do little against fine particles. Check the AQI before exercising outside, and keep children and older family members indoors when it's very unhealthy.
Our picks for Lahore's air
Air purifiers for smoke and smog
ranked by how much smoke they clear, with the room size each one can handle
See the guideFor days you have to go out
N95 masks that fit
certified masks, and how to get a seal
See the masksBuying in Pakistan
The best air purifiers in Pakistan for smog season
sold on Daraz, with prices in rupees and the room size each one can really handle
See the guideSources
- [1] Dawn, Lahore's air pollution a year-round problem, worsened by winter and agricultural burning: report (on Hamari Hawa's report) (November 2026)
- [2] Dawn (Reuters), Pakistan ranked most polluted country in 2025, data shows (March 2026)
- [3] Dawn, Inter-departmental operation against air pollution paying dividends, claims Punjab govt (October 2025)
- [4] Dawn, Punjab to ban manufacturing of petrol-run motorcycle rickshaws (November 2025)
Last reviewed by Talha Tariq Khan, who lives in Lahore. The figures in the box at the top update with every new reading; the guide itself is checked against its sources at least once a year, before the city's bad-air season.
Tree cover detail
Tree cover in Lahore: Below target
32.4% tree cover against a 45% healthy-neighborhood target, across 12.57 km².
Trees in this area
101,788
Target trees
141,372
More trees needed
39,584
CO₂ if planted / yr
870.8 t
Deforestation · 2001–2025
How much forest has Lahore lost?
There was very little forest around Lahore in 2000, about 12 hectares, and about 3 hectares of it has been lost since. Only fairly dense woodland counts as forest in these maps, so scattered street and garden trees don't show up here.
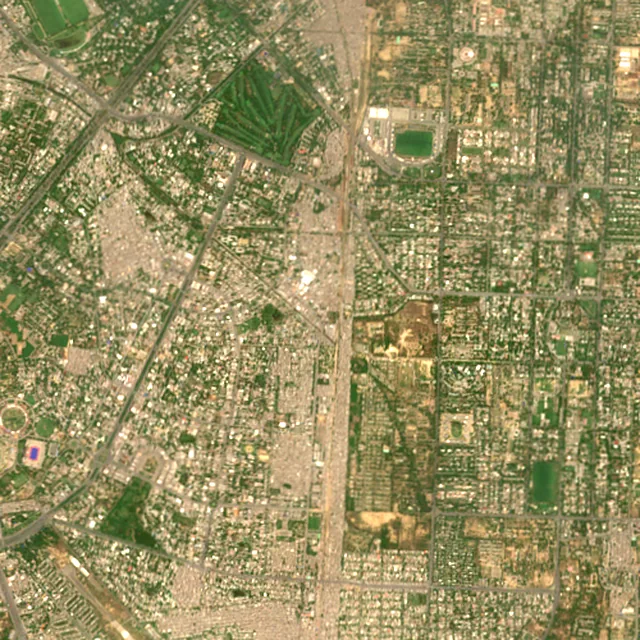
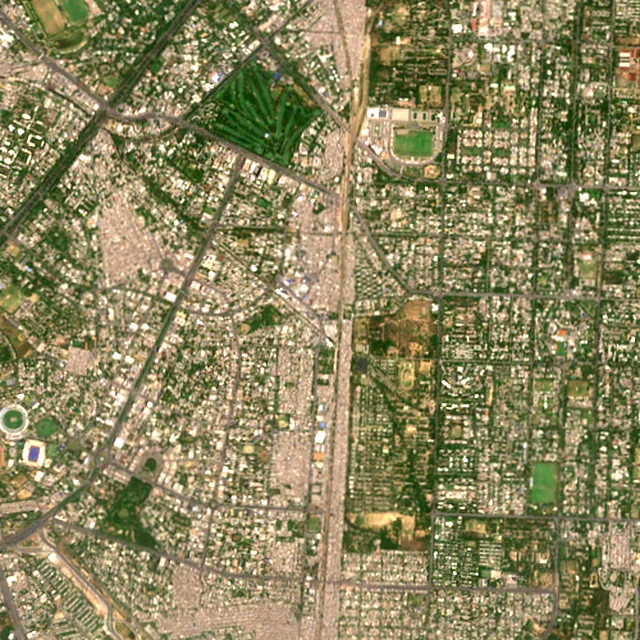

2017: satellite photo from June 2017 of a 5 × 5 km area in the city center.
The worst year was 2001, when about 3 hectares of forest were lost.
Hectares of forest lost each year
Show the figures as a table
| Year | Cleared for good | Can grow back | Total |
|---|---|---|---|
| 2001 | 1 ha | 2 ha | 3 ha |
| 2002 | under 1 ha | under 1 ha | under 1 ha |
| 2003 | under 1 ha | under 1 ha | under 1 ha |
| 2004 | under 1 ha | under 1 ha | under 1 ha |
| 2005 | under 1 ha | under 1 ha | under 1 ha |
| 2006 | under 1 ha | under 1 ha | under 1 ha |
| 2007 | under 1 ha | under 1 ha | under 1 ha |
| 2008 | under 1 ha | under 1 ha | under 1 ha |
| 2009 | under 1 ha | under 1 ha | under 1 ha |
| 2010 | under 1 ha | under 1 ha | under 1 ha |
| 2011 | under 1 ha | under 1 ha | under 1 ha |
| 2012 | under 1 ha | under 1 ha | under 1 ha |
| 2013 | under 1 ha | under 1 ha | under 1 ha |
| 2014 | under 1 ha | under 1 ha | under 1 ha |
| 2015 | under 1 ha | under 1 ha | under 1 ha |
| 2016 | under 1 ha | under 1 ha | under 1 ha |
| 2017 | under 1 ha | under 1 ha | under 1 ha |
| 2018 | under 1 ha | under 1 ha | under 1 ha |
| 2019 | under 1 ha | under 1 ha | under 1 ha |
| 2020 | under 1 ha | under 1 ha | under 1 ha |
| 2021 | under 1 ha | under 1 ha | under 1 ha |
| 2022 | under 1 ha | under 1 ha | under 1 ha |
| 2023 | under 1 ha | under 1 ha | under 1 ha |
| 2024 | under 1 ha | under 1 ha | under 1 ha |
| 2025 | under 1 ha | under 1 ha | under 1 ha |
What is causing deforestation around Lahore?
- Farms, pasture and plantationscleared for good34% · 1 ha
- Towns and roadscleared for good3.1% · under 1 ha
- Unknown causescause unknown63% · 2 ha
Causes for 2025 are estimates, based on what caused forest loss in the same places up to 2024.
These figures cover everything within 10 km of the city center, a wider area than the report above, because forest is usually lost at a city's edges.
Source: Hansen/UMD/Google/USGS/NASA, Global Forest Change (GFC-2025-v1.13); causes: WRI/Google DeepMind drivers of forest loss; both CC BY 4.0, summed by Airleaf for each area. Images: contains modified Copernicus Sentinel data. How it's measured
In the same region
Measured cities near Lahore
Same 2 km radius, same index — so they compare directly.
- Muridke32.8 km
Pakistan
- Tree cover
- 5%
- Air quality
- 205
- Raja Jang34.7 km
Pakistan
- Tree cover
- 16%
- Air quality
- 414
- Shekhupura41.3 km
Pakistan
- Tree cover
- 9%
- Air quality
- 239
- Kasur45.5 km
Pakistan
- Tree cover
- 11%
- Air quality
- 556
- Kot Radha Kishan45.9 km
Pakistan
- Tree cover
- 19%
- Air quality
- 296
- Amritsar50.2 km
India
- Tree cover
- 15%
- Air quality
- 170
Also compared:Lahore vs KarachiLahore vs IslamabadLahore vs PeshawarLahore vs Faisalabad
Build your own
Compare Lahore with anywhere
This place
Lahore
Use this data
Put Lahore's numbers on your site
Free to embed. Updates itself as the measurement refreshes.
Frequently asked
Questions about Lahore
What is the air quality (AQI) in Lahore right now?
The latest reading for Lahore shows an AQI of 241 (Very unhealthy), measured Nov 11, 18:00 local time by 37 ground monitoring stations via OpenAQ (the median of their readings; the nearest is CERP Office, 700 m away). The main pollutant is PM2.5. Health alert — everyone should avoid long outdoor exertion.
Is it safe to exercise outside in Lahore today?
At AQI 241 (Very unhealthy): everyone should avoid long or hard exercise outdoors; sensitive groups, all outdoor exertion. Windows: keep them closed. Masks: wear an N95 if you go out. The reading changes through the day, so check again before a long run or ride.
What has the air quality in Lahore been like this week?
Over the last 7 days, the CAMS air-quality model put Lahore's daily AQI at 191 on average, from 135 on Nov 7 to an hourly peak of 374 on Nov 11. On 7 of those days the average was above 100, unhealthy for sensitive groups.
Why is Lahore's air quality so bad?
Year-round pollution from transport, crop-residue burning, waste burning and industry is trapped in a much shallower layer of air in winter, from October to February, when the rice-harvest crop burning adds more. Light winds blow little of it away.
When is smog season in Lahore?
October through February. Through the 2025–26 season, monthly fine particle averages were 124–183 µg/m³, against 40–59 µg/m³ from April to September.
What is the main source of Lahore's smog?
No single source. By the Punjab Urban Unit's inventory, transport makes about 35% of Lahore's fine particles, crop-residue burning 33%, waste burning 29% and industry 3%. The often-quoted 83% for transport covers all pollutants by weight, mostly carbon monoxide.
How much forest has the area around Lahore lost since 2001?
There was very little forest around Lahore in 2000, about 12 hectares, and about 3 hectares of it has been lost since. Only fairly dense woodland counts as forest in these maps, so scattered street and garden trees don't show up here.
What is the tree count in Lahore?
Lahore has an estimated 101,788 trees across the 12.57 km² measured — 32.4% tree cover, 13 percentage points short of the 45% tree-cover target set for this area.
How many more trees does Lahore need?
Lahore needs roughly 39,584 more trees to close a 13-point shortfall against its 45% tree-cover target — about 870.8 t of extra CO₂ absorbed per year once grown.
How are Lahore's air quality and tree cover measured?
Air quality is measured by ground monitoring stations near Block N Gulberg III, via OpenAQ; the 7-day trend is the Open-Meteo / CAMS model's estimate. Tree cover is measured from Sentinel-2 L2A (ESA Copernicus) via Earth Search satellite imagery at 10 m detail across a 2 km radius around Block N Gulberg III; the tree count is an estimate derived from that cover.
See your own area
What does your neighborhood look like?
Pick any point and radius to get the same air-quality and tree-cover breakdown.
Check my address