City report · Ontario, Canada
Toronto Air quality today
Air quality in Toronto currently reads AQI 68 (Moderate): Unusually sensitive people should consider limiting long outdoor exertion.
Air quality right now
AQI 68
Moderate
- PM2.5, fine particles (µg/m³)
- 18.0
- tree cover
- 15.6%
- trees in this area
- 46.1K
- more trees needed
- 42.5K
Measured across a 2 km radius around Yonge-Bay Corridor, Toronto, ON, Canada (12.57 km²), from a satellite image of Aug 18, 2026. Lower AQI is better: 0–50 is Good, above 300 is Hazardous.
Toronto · AQI 68 (Moderate)
Toronto's tree count comes to 46,068 trees across 11.82 km² of land, 14 points below the 30% tree-cover level considered healthy for this area, so roughly 42,525 more trees would close the gap.
Air quality detail
Air quality in Toronto today: AQI 68, Moderate
Main pollutant: PM2.5 · Observed Nov 11, 09:00 local time via OpenAQ ground stations, US EPA index. Values in µg/m³.
Ground station · Toronto Downtown, 1 km away
Health signal
Unusually sensitive people should consider limiting long outdoor exertion.
PM2.5
18.0
PM10
—
NO₂
62.1
O₃
7.8
SO₂
—
CO
—
Data: OpenAQ · AirNow
- Outdoor exercise
- Fine for most people; unusually sensitive people should take long or hard exercise easier
- Windows
- Fine to open; close them if you are sensitive to pollution
- Mask
- Not needed for most people
- Air purifier
- Worth running if you are sensitive
Over the last 7 days, the CAMS air-quality model put Toronto's daily AQI at 27 on average, from 11 on Nov 9 to an hourly peak of 47 on Nov 7.
This is the US EPA AQI. How it differs from Canada's AQHI
Where Toronto stands: the most polluted cities in the world right now · the cleanest
City air guide
Why does Toronto get smoky, polluted air?
Right now
- Today's AQI in Toronto is 68, moderate, mostly from PM2.5.
- Over the past 7 days, the daily average was 27.
- Toronto's air is usually worst for Ontario wildfire season from April to October.
Toronto's air has improved over the past two decades, and the city has not had a smog advisory since 2016 [1][3]. Traffic is still the largest local source of air pollution [1]. The city also says that, because of climate change, Toronto is having more poor air quality events from wildfire smoke [3]. On June 28, 2023, smoke from fires in Ontario and Quebec pushed the city's air health index to 10 on its 10-point scale [7].
What is in Toronto's air, and where does it come from?
Toronto's air pollution is a mix of hundreds of substances, including nitrogen oxides, ozone and particulate matter, which means tiny particles in the air [1]. Most of it comes from burning gasoline, diesel, natural gas and coal in cars, trucks, home furnaces, industry and power plants [1]. Traffic is the largest local source, followed by industrial and residential sources [1].
Some pollution also blows in from elsewhere [1]. A 2014 Toronto Public Health report found that over half of Toronto's air pollution is emitted inside the city's boundaries [4]. Ontario's environment ministry says pollution from the United States and beyond makes up a significant part of the province's ozone when ozone levels are high [5].
In Ontario's 2023 air quality report, the highest average levels of nitrogen dioxide were found in big urban areas with heavy vehicle traffic, such as the Greater Toronto Area [6].
How much harm does air pollution do in Toronto?
In April 2014, Toronto Public Health estimated that air pollution from all sources led to about 1,300 premature deaths and 3,550 hospitalizations in the city each year [4]. That was 23% fewer deaths and 41% fewer hospitalizations than its 2004 estimates [4].
Traffic had the greatest health impact of any source, with about 280 premature deaths and 1,090 hospitalizations a year [4]. That is about 1 in 5 of the premature deaths linked to air pollution in the city [4]. The city says air pollution can cause heart and breathing problems and is linked to cancer and other chronic diseases [1].
Does Toronto still get smog?
Smog is a mix of pollutants, mainly ground-level ozone and fine particles, and it can look like a brownish haze [1]. It can happen at any time of year, but it is most common in summer [1]. Smog advisories used to be common in Toronto, but the city has not had one since 2016 [1]. The city says smog remains possible [1].
Across Ontario, from 2014 to 2023, nitrogen dioxide fell by 28% and fine particles, called PM2.5, fell by 12% [5]. Ozone showed no clear trend up or down [5]. In 2023, 20 of the province's monitoring stations measured ozone above Ontario's one-hour limit at least once [6]. Ozone goes over that limit in the warmer months, while winter levels in 2023 were well below it [6].
Why does wildfire smoke reach Toronto?
Wildfire season in Ontario typically runs from early April to late October [6]. Hot smoke can be lifted several kilometres above the ground and carried hundreds or thousands of kilometres from the fires [6]. Fine particles are the main pollutant of concern in wildfire smoke [6].
The city says that because of climate change, Toronto, like many parts of North America, is having more poor air quality events due to wildfire smoke [3]. These events may undo some of the progress made in cutting pollution [3].
What happened in the smoke events of 2023 and 2025?
Ontario called 2023 an unprecedented wildfire season [5]. Fires burned about 15 million hectares across Canada, about six times a typical year [6]. Ontario issued 13 air quality alerts covering 55 days, and 7 of them, covering 49 days, were for wildfire smoke [5]. Winds carried smoke from Quebec into southern Ontario from May 29 to June 10, then from northern Ontario and Quebec from June 11 to July 1 [6].
The Air Quality Health Index, or AQHI, is Canada's 1 to 10+ scale of health risk from air pollution, based on ozone, nitrogen dioxide and particulate matter [2]. On June 28, 2023, Toronto's AQHI reached 10 [7]. That afternoon, a ranking by the air quality tracker IQAir listed Toronto as the worst of the world's major cities for air quality [7]. On Toronto Public Health's advice, city outdoor recreation programs moved indoors [7].
On July 14, 2025, smoke from fires in northern Ontario and the Prairies put parts of the Toronto area under a special air quality statement, during a heat warning [8]. IQAir ranked Toronto the second most polluted major city in the world at 8 a.m. that day [8].
What is Toronto doing about poor air?
Toronto Public Health has a Wildfire Smoke Response Strategy, which it reviews and updates every year [2]. Air quality alerts come jointly from Ontario's environment ministry and Environment and Climate Change Canada [2]. A yellow warning means the AQHI is forecast to reach 7 or more, a high risk, and an orange warning means 10 or more, a very high risk [2].
Since 2024, the Cleaner Air Spaces Network has offered places with air filtration systems rated MERV 13 for people who struggle to get clean air at home [2]. They include City Hall, Metro Hall and the civic centres in Scarborough, North York, East York and York [2].
To cut traffic pollution, a city by-law bans running a parked vehicle's engine for more than 60 seconds [1]. The TransformTO Net Zero Strategy aims to bring the city's greenhouse gas emissions to net zero by 2040 [1].
How to protect yourself in Toronto
Check the AQHI when planning time outdoors, and cut back on strenuous outdoor activity when it is high [2]. Children, older adults, pregnant people, people who spend a lot of time outdoors and people with heart or lung conditions may be more affected [2].
When the air is poor, keep windows and doors closed [1][2]. Use the best filter your heating and cooling system is approved for, and set it to recirculate if you can [1]. Without such a system, a portable air cleaner with a HEPA filter can clean the air in one area of your home [1]. Avoid candles, incense, frying and gas stoves indoors [1].
If you must be outside in smoke, a well-fitted N95 respirator can cut the fine particles you breathe, but not the gases in smoke [2]. Respirators should not be used by children under 2 [2]. If you cannot get clean air at home, a library, recreation centre, shopping mall or Cleaner Air Space can help [1][2].
Sources
- [1] City of Toronto, Toronto Public Health, Air Pollution (September 2026)
- [2] City of Toronto, Toronto Public Health, Wildfire Smoke (July 2026)
- [3] City of Toronto, Air Quality
- [4] Toronto Public Health, Path to Healthier Air: Toronto Air Pollution Burden of Illness Update (April 2014)
- [5] Ontario Ministry of the Environment, Conservation and Parks, Air Quality in Ontario 2023 Report (August 2025)
- [6] Ontario Ministry of the Environment, Conservation and Parks, 10-year trends and annual results, Air Quality in Ontario 2023 Report (August 2025)
- [7] CBC News, Poor air quality may persist in Toronto on Thursday, Friday due to wildfire smoke (June 2023)
- [8] CBC News, Wildfire smoke puts Toronto among worst in the world for air quality; weather alerts in place (July 2025)
Last reviewed . The figures in the box at the top update with every new reading; the guide itself is checked against its sources at least once a year, before the city's bad-air season.
Tree cover detail
Tree cover in Toronto: Critically low
15.6% tree cover against a 30% healthy-neighborhood target, across 11.82 km² of land.
Trees in this area
46,068
Target trees
88,593
More trees needed
42,525
CO₂ if planted / yr
935.5 t
Deforestation · 2001–2025
How much forest has Toronto lost?
Since 2001, the area within 10 km of Toronto has lost about 16 hectares of forest (about 22 football pitches): under 1% of the forest it had in 2000. Most of it (68%) was deforestation, forest cleared for good, mainly for towns and roads.
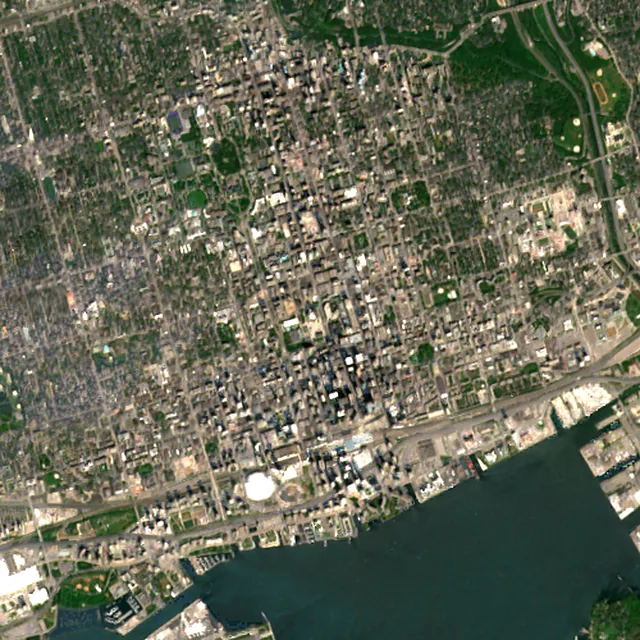
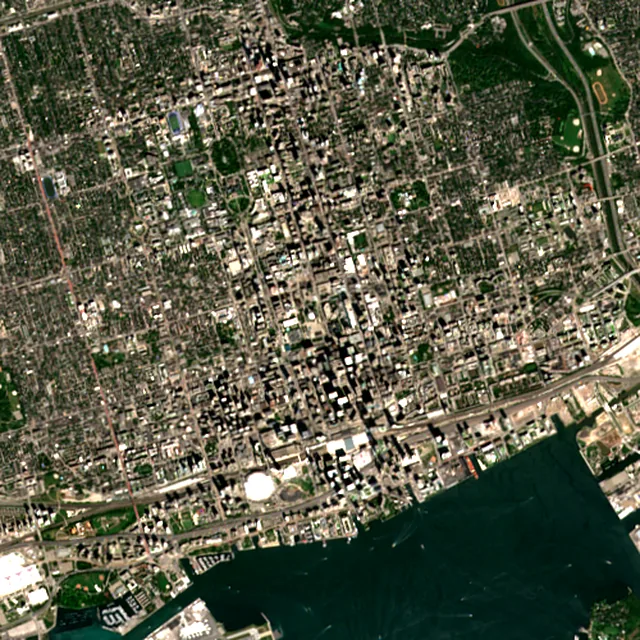

2017: satellite photo from August 2017 of a 5 × 5 km area in the city center.
- Forest lost since 2001
- 16 haabout 22 football pitches
- Share of its forest
- under 1%of what there was in 2000
- Cleared for good
- 11 hadeforestation: turned into farms, mines or towns
The worst year was 2008, when about 3 hectares of forest were lost.
Hectares of forest lost each year
Show the figures as a table
| Year | Cleared for good | Can grow back | Total |
|---|---|---|---|
| 2001 | under 1 ha | under 1 ha | under 1 ha |
| 2002 | under 1 ha | under 1 ha | under 1 ha |
| 2003 | under 1 ha | under 1 ha | under 1 ha |
| 2004 | under 1 ha | under 1 ha | under 1 ha |
| 2005 | under 1 ha | under 1 ha | under 1 ha |
| 2006 | under 1 ha | under 1 ha | under 1 ha |
| 2007 | under 1 ha | under 1 ha | under 1 ha |
| 2008 | 3 ha | under 1 ha | 3 ha |
| 2009 | under 1 ha | under 1 ha | under 1 ha |
| 2010 | under 1 ha | under 1 ha | under 1 ha |
| 2011 | under 1 ha | under 1 ha | under 1 ha |
| 2012 | under 1 ha | under 1 ha | under 1 ha |
| 2013 | under 1 ha | under 1 ha | under 1 ha |
| 2014 | under 1 ha | under 1 ha | under 1 ha |
| 2015 | under 1 ha | under 1 ha | under 1 ha |
| 2016 | under 1 ha | under 1 ha | under 1 ha |
| 2017 | under 1 ha | under 1 ha | under 1 ha |
| 2018 | under 1 ha | under 1 ha | under 1 ha |
| 2019 | under 1 ha | under 1 ha | under 1 ha |
| 2020 | under 1 ha | under 1 ha | under 1 ha |
| 2021 | under 1 ha | under 1 ha | 1 ha |
| 2022 | under 1 ha | under 1 ha | 1 ha |
| 2023 | under 1 ha | under 1 ha | under 1 ha |
| 2024 | 2 ha | under 1 ha | 2 ha |
| 2025 | 2 ha | under 1 ha | 2 ha |
What is causing deforestation around Toronto?
- Towns and roadscleared for good67% · 11 ha
- Unknown causescause unknown33% · 5 ha
Causes for 2025 are estimates, based on what caused forest loss in the same places up to 2024.
Forest gained and lost, 2000–2020
- Forest in 2000
- 7,020 ha
- Forest in 2020
- 7,070 ha
- Overall change
- +54 hamore forest than in 2000
Comparing satellite maps from 2000 and 2020, the forest around Toronto stayed about the same size, at about 7,070 hectares: new forest grew on about 130 hectares, and about 76 hectares were lost.
These 2000 and 2020 maps, from the University of Maryland, count any land with trees taller than 5 m as forest, including plantations and orchards. Forest that was cut or burned and had grown back by 2020 counts in both years, so the loss here is smaller than the yearly figures.
These figures cover everything within 10 km of the city center, a wider area than the report above, because forest is usually lost at a city's edges.
Source: Hansen/UMD/Google/USGS/NASA, Global Forest Change (GFC-2025-v1.13); causes: WRI/Google DeepMind drivers of forest loss; both CC BY 4.0, summed by Airleaf for each area. Forest gained and lost 2000–2020: Potapov et al. 2022, UMD GLAD Global Land Cover and Land Use Change, CC BY 4.0. Images: contains modified Copernicus Sentinel data. How it's measured
In the same region
Measured cities near Toronto
Same 2 km radius, same index — so they compare directly.
- Etobicoke15.1 km
Canada
- Tree cover
- 36%
- Air quality
- 44
- Vaughan22.3 km
Canada
- Tree cover
- 19%
- Air quality
- 33
- Mississauga23.6 km
Canada
- Tree cover
- 23%
- Air quality
- 58
- Markham25.5 km
Canada
- Tree cover
- 39%
- Air quality
- 36
- Brampton31.0 km
Canada
- Tree cover
- 37%
- Air quality
- 31
- Oakville33.1 km
Canada
- Tree cover
- 44%
- Air quality
- 28
Also compared:Toronto vs VancouverToronto vs OttawaToronto vs MontréalToronto vs Calgary
Build your own
Compare Toronto with anywhere
This place
Toronto
Use this data
Put Toronto's numbers on your site
Free to embed. Updates itself as the measurement refreshes.
Frequently asked
Questions about Toronto
What is the air quality (AQI) in Toronto right now?
The latest reading for Toronto shows an AQI of 68 (Moderate), measured Nov 11, 09:00 local time by the Toronto Downtown ground monitoring station, 1 km away, via OpenAQ. The main pollutant is PM2.5. Unusually sensitive people should consider limiting long outdoor exertion.
Is it safe to exercise outside in Toronto today?
At AQI 68 (Moderate): fine for most people; unusually sensitive people should take long or hard exercise easier. Windows: fine to open; close them if you are sensitive to pollution. Masks: not needed for most people. The reading changes through the day, so check again before a long run or ride.
What has the air quality in Toronto been like this week?
Over the last 7 days, the CAMS air-quality model put Toronto's daily AQI at 27 on average, from 11 on Nov 9 to an hourly peak of 47 on Nov 7. No day averaged above 100, the level where the air turns unhealthy for sensitive groups.
When is wildfire smoke most likely in Toronto?
Ontario's wildfire season typically runs from early April to late October. Smoke can travel hundreds or thousands of kilometres, so fires in northern Ontario or Quebec can bring smoke to Toronto.
Does Toronto still have smog advisories?
Smog advisories used to be common in Toronto, but the city has not had one since 2016. The city says smog is still possible, and it is most common in summer.
What is the main source of air pollution in Toronto?
Traffic is the largest local source, followed by industry and homes. Some pollution also blows in from other parts of Ontario and the United States.
What does the AQHI number mean in Toronto?
The Air Quality Health Index rates health risk from air pollution on a scale from 1 to 10+. A yellow warning is issued when it is forecast to reach 7 or more, and an orange warning when it reaches 10 or more.
How bad was Toronto's air in June 2023?
On June 28, 2023, wildfire smoke from Ontario and Quebec pushed Toronto's AQHI to 10, and for part of that afternoon IQAir ranked Toronto's air the worst of the world's major cities.
Where can I find cleaner air in Toronto during smoke?
The city's Cleaner Air Spaces, such as City Hall, Metro Hall and the civic centres, have filtration systems rated MERV 13 and are open in their regular hours. Libraries, recreation centres and malls with air conditioning can also help.
Is Toronto's AQI the same as Canada's AQHI?
No. Airleaf shows the US EPA Air Quality Index (AQI), the scale used by IQAir and most air-quality apps. Canada's Air Quality Health Index (AQHI), from Environment and Climate Change Canada, runs from 1 to 10 and above: 1–3 low risk, 4–6 moderate, 7–10 high and over 10 very high. It combines ozone, nitrogen dioxide and fine particles into one health-risk number, so it isn't a converted AQI, and the two can move differently, especially in wildfire smoke.
How much forest has the area around Toronto lost since 2001?
Since 2001, the area within 10 km of Toronto has lost about 16 hectares of forest (about 22 football pitches): under 1% of the forest it had in 2000. Most of it (68%) was deforestation, forest cleared for good, mainly for towns and roads. Comparing satellite maps from 2000 and 2020, the forest around Toronto stayed about the same size, at about 7,070 hectares: new forest grew on about 130 hectares, and about 76 hectares were lost.
What is the tree count in Toronto?
Toronto has an estimated 46,068 trees across the 11.82 km² of land measured — 15.6% tree cover, 14 percentage points short of the 30% tree-cover target set for this area.
How many more trees does Toronto need?
Toronto needs roughly 42,525 more trees to close a 14-point shortfall against its 30% tree-cover target — about 935.5 t of extra CO₂ absorbed per year once grown.
How are Toronto's air quality and tree cover measured?
Air quality is measured by ground monitoring stations near Yonge-Bay Corridor, via OpenAQ; the 7-day trend is the Open-Meteo / CAMS model's estimate. Tree cover is measured from Sentinel-2 L2A (ESA Copernicus) via Earth Search satellite imagery at 10 m detail across a 2 km radius around Yonge-Bay Corridor; the tree count is an estimate derived from that cover.
See your own area
What does your neighborhood look like?
Pick any point and radius to get the same air-quality and tree-cover breakdown.
Check my address