City report · Alberta, Canada
Calgary Air quality today
Air quality in Calgary currently reads AQI 52 (Moderate): Unusually sensitive people should consider limiting long outdoor exertion.
AQI 52
Air quality right now
Moderate
- PM2.5, fine particles (µg/m³)
- 9.9
- tree cover
- 19.8%
- trees in this area
- 60.4K
- more trees needed
- 31.1K
Measured across a 2 km radius around Hillhurst, Calgary, AB, Canada (12.57 km²), from a satellite image of Aug 18, 2026. Lower AQI is better: 0–50 is Good, above 300 is Hazardous.
Calgary · AQI 52 (Moderate)
Calgary's tree count comes to 60,400 trees across 12.21 km² of land, 10 points below the 30% tree-cover level considered healthy for this area, so roughly 31,115 more trees would close the gap.
Air quality detail
Air quality in Calgary today: AQI 52, Moderate
Main pollutant: PM2.5 · Observed Nov 11, 09:00 local time via OpenAQ ground stations, US EPA index. Values in µg/m³.
Ground station · Calgary Central2, 800 m away
Health signal
Unusually sensitive people should consider limiting long outdoor exertion.
PM2.5
9.9
PM10
—
NO₂
71.5
O₃
3.9
SO₂
—
CO
1031.0
Data: OpenAQ · AirNow
- Outdoor exercise
- Fine for most people; unusually sensitive people should take long or hard exercise easier
- Windows
- Fine to open; close them if you are sensitive to pollution
- Mask
- Not needed for most people
- Air purifier
- Worth running if you are sensitive
Over the last 7 days, the CAMS air-quality model put Calgary's daily AQI at 39 on average, from 12 on Nov 7 to an hourly peak of 108 on Nov 4.
This is the US EPA AQI. How it differs from Canada's AQHI
Where Calgary stands: the most polluted cities in the world right now · the cleanest
City air guide
Why does Calgary's air turn smoky and unhealthy?
Right now
- Today's AQI in Calgary is 52, moderate, mostly from PM2.5.
- Over the past 7 days, the daily average was 39.
Calgary's air has turned very unhealthy when wildfire smoke drifts in from fires in British Columbia, Alberta, Saskatchewan and the Northwest Territories [1] [2] [3]. In 2023, Calgary had its smokiest year on record [1]. The Air Quality Health Index reached 10+, its very high risk level, in Calgary in September 2023, June 2025 and September 2025 [1] [2] [3]. A temperature inversion, which is not frequent in Calgary, can also trap pollution near the ground [8].
What is the Air Quality Health Index, and what does 10+ mean?
The Air Quality Health Index, or AQHI, gives a number from 1 to 10 for the health risk of local air [4]. The higher the number, the greater the risk [4]. During extreme events, such as a wildfire smoke event, it can reach 10+, which means very high health risk [4].
The index is worked out from three common pollutants: ground-level ozone, fine particulate matter and nitrogen dioxide [5]. Alberta Health Services says the biggest health risk in wildfire smoke comes from small particles called PM2.5, which are too small to see [6].
How bad was the wildfire smoke in 2023?
By the morning of September 4, 2023, Calgary had logged 476 smoky hours that year, according to Environment and Climate Change Canada [1]. The agency said it was the smokiest year on record for the city [1]. The previous record was 450 hours, set in 2018 [1].
A smoke hour is an hour when smoke cuts visibility to 9.7 kilometres or less, as measured by weather observers at stations such as international airports [2]. Since 1990, Calgary has averaged 73 smoke hours a year [2].
On the morning of September 4, 2023, Calgary's AQHI was rated 10+, or very high risk [1]. A Global Calgary meteorologist said dense smoke was moving in from northern British Columbia, pulled in by a high-pressure system over the province [1].
What happened in 2024 and 2025?
On the morning of June 11, 2025, the AQHI read 10+ in Calgary, Edmonton, Lethbridge and Red Deer [3]. Smoke from wildfires in northern British Columbia, Alberta and Saskatchewan covered most of the province [3]. Environment Canada issued air quality warnings, and several track meets in Calgary were cancelled [3].
From the start of 2025 to September 2, only 52 smoke hours had been recorded at Calgary International Airport [2]. Then a smoke plume covered the city on September 2 and 3, 2025, and the AQHI read 10+ early on September 2 [2]. An Environment and Climate Change Canada meteorologist said another plume from the Northwest Territories was expected to track through Alberta to Calgary [2].
The Calgary Region Airshed Zone, a group that runs air monitoring stations in and around the city, said its sensors showed a much less smoky 2025 than 2024, up to early September [2]. Its program manager said forest fires had affected Calgary a lot in 2024, with more PM2.5 exceedances than in 2025 [2].
Can an inversion trap pollution over Calgary?
Yes, though not often. In March 2018, Environment Canada issued a special air quality statement for Calgary because high pollution built up under a temperature inversion [8]. An inversion is when a layer of warmer air sits over heavier cold air near the ground [8].
Pollution normally rises away on air currents, but an inversion traps it at ground level [8]. Global News reported that this is not frequent in Calgary, but it sometimes happens as a chinook weather pattern is unfolding [8].
Where does Calgary's everyday pollution come from?
A University of Calgary study, reported in February 2018, mapped ozone, nitrogen dioxide and PM2.5 across the city [7]. It found pollution tends to be higher along main traffic corridors [7]. Deerfoot Trail, which runs north to south, is a major source of local pollution [7].
In summer, northeast Calgary had the most localized bad air [7]. That area has several traffic corridors, more industrial emitters and the international airport [7]. In winter, parts of south Calgary had some of the highest levels [7].
The researchers said Calgary's air quality is pretty good overall [7]. In an international comparison published in 2016, Calgary had lower PM2.5 levels than Montreal, Toronto and Edmonton [7].
Who is most at risk from smoke and poor air?
Alberta's health authority lists people with heart or lung disease, people aged 65 and older, pregnant people and children as being at higher risk [6]. So are people experiencing houselessness and people who do heavy outdoor work or sports [6].
Air pollution can irritate the lungs and airways, make it harder to breathe, and worsen heart disease and asthma [5]. On days when pollution is much higher than usual, even people outside these groups may notice symptoms [5].
How to protect yourself in Calgary
Check the AQHI before heading outside, and use its forecasts to plan your day [4]. At high risk, 7 to 10, people at risk should reduce or reschedule strenuous outdoor activity, and children and older adults should take it easy [4]. At 10+, everyone should reduce or reschedule strenuous outdoor activity, and children and older adults should avoid outdoor exertion [4].
When smoke is a problem, Alberta Health Services advises closing all windows and doors, including attached garage doors [6]. Use a portable air cleaner with a HEPA filter, and set up a cleaner-air room with the doors and windows closed [6]. If you have a forced-air furnace, a MERV 13 or higher filter may help lower smoke in your home [6].
Avoid things that make indoor air worse, such as wood-burning fireplaces, vacuuming and candles [6]. A well-fitted N95, KN95 or P100 respirator mask can filter fine particles, but not the gases in smoke [6]. If you have chest pain, shortness of breath or another emergency, call 911 [6].
Sources
- [1] Global News, Poor air quality reported across Alberta as wildfire smoke lingers (September 2023)
- [2] The Weather Network, Calgary was on track for its least-smoky summer in years, but not anymore (September 2025)
- [3] Global News, Smoke prompts warnings from Alberta health experts, restrictions on outdoor activities (June 2025)
- [4] Government of Alberta, Environment and Protected Areas, About the Air Quality Health Index
- [5] Government of Alberta, Environment and Protected Areas, Air quality and health
- [6] Alberta Health Services, MyHealth.Alberta.ca, Wildfire smoke and your health (May 2026)
- [7] University of Calgary, UCalgary researchers map out seasonal surprise in city air quality (February 2018)
- [8] Global News, Air quality statement ended for Calgary (March 2018)
Last reviewed . The figures in the box at the top update with every new reading; the guide itself is checked against its sources at least once a year, before the city's bad-air season.
Tree cover detail
Tree cover in Calgary: Below target
19.8% tree cover against a 30% healthy-neighborhood target, across 12.21 km² of land.
Trees in this area
60,400
Target trees
91,515
More trees needed
31,115
CO₂ if planted / yr
684.5 t
Deforestation · 2001–2025
How much forest has Calgary lost?
Since 2001, the area within 10 km of Calgary has lost about 154 hectares of forest (about 220 football pitches): 15% of the forest it had in 2000. Most of it (92%) was deforestation, forest cleared for good, mainly for towns and roads.
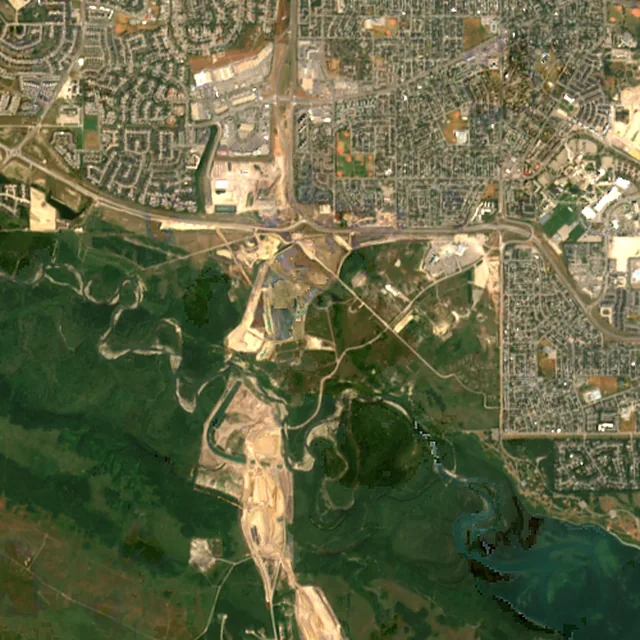
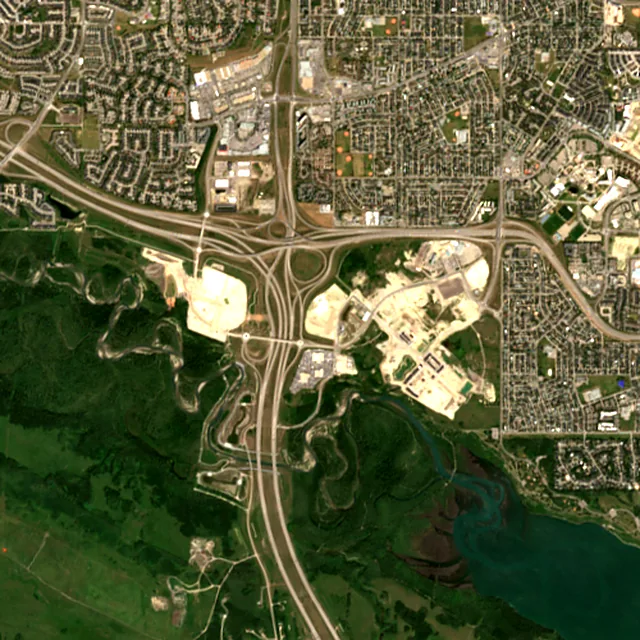
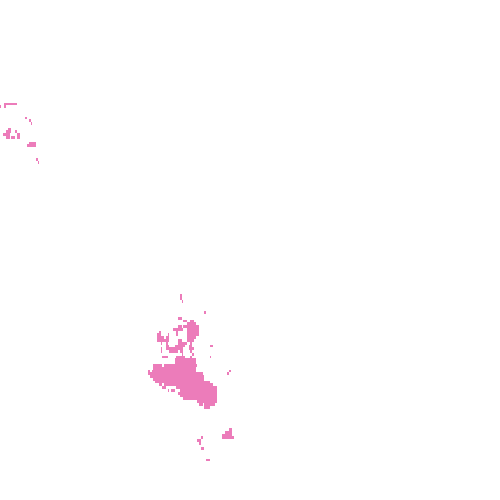
2017: satellite photo from July 2017 of a 5 × 5 km area about 7 km southwest of the city center.
- Forest lost since 2001
- 154 haabout 220 football pitches
- Share of its forest
- 15%of what there was in 2000
- Cleared for good
- 143 hadeforestation: turned into farms, mines or towns
The worst year was 2017, when about 37 hectares of forest were lost.
Hectares of forest lost each year
Show the figures as a table
| Year | Cleared for good | Can grow back | Total |
|---|---|---|---|
| 2001 | under 1 ha | under 1 ha | 2 ha |
| 2002 | under 1 ha | under 1 ha | 1 ha |
| 2003 | 1 ha | under 1 ha | 1 ha |
| 2004 | 9 ha | under 1 ha | 10 ha |
| 2005 | 3 ha | under 1 ha | 4 ha |
| 2006 | 13 ha | under 1 ha | 13 ha |
| 2007 | 7 ha | under 1 ha | 7 ha |
| 2008 | 6 ha | under 1 ha | 6 ha |
| 2009 | 1 ha | under 1 ha | 1 ha |
| 2010 | 2 ha | under 1 ha | 2 ha |
| 2011 | 4 ha | under 1 ha | 4 ha |
| 2012 | 2 ha | under 1 ha | 3 ha |
| 2013 | 3 ha | under 1 ha | 4 ha |
| 2014 | 1 ha | under 1 ha | 2 ha |
| 2015 | under 1 ha | under 1 ha | under 1 ha |
| 2016 | 26 ha | under 1 ha | 26 ha |
| 2017 | 37 ha | under 1 ha | 37 ha |
| 2018 | under 1 ha | under 1 ha | under 1 ha |
| 2019 | under 1 ha | under 1 ha | under 1 ha |
| 2020 | 6 ha | 1 ha | 7 ha |
| 2021 | 1 ha | under 1 ha | 1 ha |
| 2022 | 4 ha | under 1 ha | 4 ha |
| 2023 | under 1 ha | under 1 ha | under 1 ha |
| 2024 | 9 ha | 3 ha | 12 ha |
| 2025 | 5 ha | under 1 ha | 6 ha |
What is causing deforestation around Calgary?
- Towns and roadscleared for good68% · 105 ha
- Mining and energycleared for good24% · 37 ha
- Storms, floods and other natural causescan grow back2.7% · 4 ha
Also: logging, unknown causes.
Causes for 2025 are estimates, based on what caused forest loss in the same places up to 2024.
Forest gained and lost, 2000–2020
- Forest in 2000
- 1,230 ha
- Forest in 2020
- 1,060 ha
- Overall change
- −174 haless forest than in 2000
Comparing satellite maps from 2000 and 2020, the forest around Calgary shrank from about 1,230 hectares to 1,060 hectares, a net loss of about 174 hectares (−14%). New forest grew on about 32 hectares, but 206 hectares were lost.
These 2000 and 2020 maps, from the University of Maryland, count any land with trees taller than 5 m as forest, including plantations and orchards. Forest that was cut or burned and had grown back by 2020 counts in both years, so the loss here is smaller than the yearly figures.
These figures cover everything within 10 km of the city center, a wider area than the report above, because forest is usually lost at a city's edges.
Source: Hansen/UMD/Google/USGS/NASA, Global Forest Change (GFC-2025-v1.13); causes: WRI/Google DeepMind drivers of forest loss; both CC BY 4.0, summed by Airleaf for each area. Forest gained and lost 2000–2020: Potapov et al. 2022, UMD GLAD Global Land Cover and Land Use Change, CC BY 4.0. Images: contains modified Copernicus Sentinel data. How it's measured
In the same region
Measured cities near Calgary
Same 2 km radius, same index — so they compare directly.
- Red Deer136.7 km
Canada
- Tree cover
- 31%
- Air quality
- 19
- Lethbridge174.9 km
Canada
- Tree cover
- 26%
- Air quality
- 23
- Edmonton281.1 km
Canada
- Tree cover
- 36%
- Air quality
- 26
- Kelowna403.5 km
Canada
- Tree cover
- 22%
- Air quality
- 21
- Kamloops439.5 km
Canada
- Tree cover
- 18%
- Air quality
- 21
- Spokane448.0 km
United States
- Tree cover
- 27%
- Air quality
- 88
Also compared:Calgary vs TorontoCalgary vs VancouverCalgary vs OttawaCalgary vs Montréal
Build your own
Compare Calgary with anywhere
This place
Calgary
Use this data
Put Calgary's numbers on your site
Free to embed. Updates itself as the measurement refreshes.
Frequently asked
Questions about Calgary
What is the air quality (AQI) in Calgary right now?
The latest reading for Calgary shows an AQI of 52 (Moderate), measured Nov 11, 09:00 local time by the Calgary Central2 ground monitoring station, 800 m away, via OpenAQ. The main pollutant is PM2.5. Unusually sensitive people should consider limiting long outdoor exertion.
Is it safe to exercise outside in Calgary today?
At AQI 52 (Moderate): fine for most people; unusually sensitive people should take long or hard exercise easier. Windows: fine to open; close them if you are sensitive to pollution. Masks: not needed for most people. The reading changes through the day, so check again before a long run or ride.
What has the air quality in Calgary been like this week?
Over the last 7 days, the CAMS air-quality model put Calgary's daily AQI at 39 on average, from 12 on Nov 7 to an hourly peak of 108 on Nov 4. No day averaged above 100, the level where the air turns unhealthy for sensitive groups.
Where does Calgary's wildfire smoke come from?
From wildfires outside the city. Smoke has drifted into Calgary from fires in British Columbia, Alberta, Saskatchewan and the Northwest Territories.
What was Calgary's smokiest year on record?
2023. By early September 2023, Calgary had logged 476 smoky hours, beating the previous record of 450 hours set in 2018, according to Environment and Climate Change Canada.
What does an AQHI of 10+ mean in Calgary?
It is the top of the Air Quality Health Index scale and means very high health risk. Everyone should reduce or reschedule strenuous outdoor activity, and children and older adults should avoid outdoor exertion.
Do temperature inversions affect Calgary's air?
Sometimes. A temperature inversion, where warm air sits over cold air near the ground, is not frequent in Calgary but can happen as a chinook unfolds, trapping pollution at ground level.
Which part of Calgary has the most air pollution?
A 2018 University of Calgary study found pollution was higher along main traffic corridors such as Deerfoot Trail. Northeast Calgary had the most localized bad air in summer, and parts of south Calgary had some of the highest levels in winter.
Is Calgary's AQI the same as Canada's AQHI?
No. Airleaf shows the US EPA Air Quality Index (AQI), the scale used by IQAir and most air-quality apps. Canada's Air Quality Health Index (AQHI), from Environment and Climate Change Canada, runs from 1 to 10 and above: 1–3 low risk, 4–6 moderate, 7–10 high and over 10 very high. It combines ozone, nitrogen dioxide and fine particles into one health-risk number, so it isn't a converted AQI, and the two can move differently, especially in wildfire smoke.
How much forest has the area around Calgary lost since 2001?
Since 2001, the area within 10 km of Calgary has lost about 154 hectares of forest (about 220 football pitches): 15% of the forest it had in 2000. Most of it (92%) was deforestation, forest cleared for good, mainly for towns and roads. Comparing satellite maps from 2000 and 2020, the forest around Calgary shrank from about 1,230 hectares to 1,060 hectares, a net loss of about 174 hectares (−14%). New forest grew on about 32 hectares, but 206 hectares were lost.
What is the tree count in Calgary?
Calgary has an estimated 60,400 trees across the 12.21 km² of land measured — 19.8% tree cover, 10 percentage points short of the 30% tree-cover target set for this area.
How many more trees does Calgary need?
Calgary needs roughly 31,115 more trees to close a 10-point shortfall against its 30% tree-cover target — about 684.5 t of extra CO₂ absorbed per year once grown.
How are Calgary's air quality and tree cover measured?
Air quality is measured by ground monitoring stations near Hillhurst, via OpenAQ; the 7-day trend is the Open-Meteo / CAMS model's estimate. Tree cover is measured from Sentinel-2 L2A (ESA Copernicus) via Earth Search satellite imagery at 10 m detail across a 2 km radius around Hillhurst; the tree count is an estimate derived from that cover.
See your own area
What does your neighborhood look like?
Pick any point and radius to get the same air-quality and tree-cover breakdown.
Check my address