City report · Pennsylvania, United States
Pittsburgh Air quality today
Air quality in Pittsburgh currently reads AQI 64 (Moderate): Unusually sensitive people should consider limiting long outdoor exertion.
Air quality right now
AQI 64
Moderate
- PM2.5, fine particles (µg/m³)
- 16.3
- tree cover
- 26.2%
- trees in this area
- 70.0K
- more trees needed
- 10.1K
Measured across a 1.2 mi (2 km) radius around Downtown, Pittsburgh, PA, USA (4.9 sq mi), from a satellite image of Sep 14, 2026. Lower AQI is better: 0–50 is Good, above 300 is Hazardous.
Pittsburgh · AQI 64 (Moderate)
Pittsburgh's tree count comes to 69,963 trees across 4.1 sq mi (10.68 km²) of land, 4 points below the 30% tree-cover level considered healthy for this area, so roughly 10,147 more trees would close the gap.
Air quality detail
Air quality in Pittsburgh today: AQI 64, Moderate
Main pollutant: PM2.5 · Observed Nov 11, 09:00 local time via OpenAQ ground stations, US EPA index. Values in µg/m³.
Ground station · Lawrenceville, 2.5 mi (4 km) away · median of 2 stations
Health signal
Unusually sensitive people should consider limiting long outdoor exertion.
PM2.5
16.3
PM10
—
NO₂
—
O₃
0.0
SO₂
—
CO
—
Data: OpenAQ · AirNow
- Outdoor exercise
- Fine for most people; unusually sensitive people should take long or hard exercise easier
- Windows
- Fine to open; close them if you are sensitive to pollution
- Mask
- Not needed for most people
- Air purifier
- Worth running if you are sensitive
Over the last 7 days, the CAMS air-quality model put Pittsburgh's daily AQI at 36 on average, from 22 on Nov 5 to an hourly peak of 78 on Nov 10.
Where Pittsburgh stands: the most polluted cities in the world right now · the cleanest
City air guide
How bad is Pittsburgh's air quality?
Right now
- Today's AQI in Pittsburgh is 64, moderate, mostly from PM2.5.
- Over the past 7 days, the daily average was 36.
The American Lung Association's 2026 report, based on 2022 to 2024 data, gave the Pittsburgh metro area failing grades on all three of its air pollution measures [1]. The area ranked 11th worst in the US for short-term spikes in particle pollution [1]. Industry in the Monongahela River valley, and inversions that trap pollution near the ground, are a big part of the problem [2] [8].
How does Pittsburgh compare with other US cities?
The Lung Association's 2026 report covers the Pittsburgh-Weirton-Steubenville metro area, using 2022 to 2024 data [1]. It got an F for ozone smog, an F for short-term particle pollution and a failing grade for year-round particle pollution [1].
The area ranked 11th worst in the country for short-term particle spikes, 16th worst for year-round particle pollution and 63rd worst for ozone [1]. Allegheny County averaged 9.3 days a year with unhealthy particle spikes, down from 10.8 in the previous report [1]. The area's year-round level was its best ever, but Allegheny County still failed, with levels above the federal standard [1].
What is PM2.5, and why does it matter?
PM2.5 means fine particles 2.5 micrometers across or smaller [10]. An average human hair is about 70 micrometers wide [10]. Among particles, PM2.5 poses the greatest risk to health [10]. Many fine particles form in the air from gases such as sulfur dioxide, given off by power plants, industry and vehicles [10].
Allegheny County's health department says particle pollution can cause coughing, wheezing and asthma attacks [8]. It is also linked to heart attacks, strokes and early death in people with heart or lung disease [8].
Why do the river valleys trap pollution?
An inversion happens when a warm layer of air sits above colder air near the ground [2]. Pollution that would normally blow away gets trapped close to the ground [2].
The Mon Valley is a string of towns along the Monongahela River, about 20 miles south of Pittsburgh [2]. Like all valleys, it is prone to stagnant air, because the hills around it hem it in [2]. In an episode reported in January 2020, starting on December 21, the region's daily particle levels broke federal safety standards for six days in a row [2]. At one point, a monitor near the Clairton Coke Works recorded the worst air quality in the US [2].
What role does the Clairton Coke Works play?
U.S. Steel's Clairton Coke Works is one of the region's main sources of air pollution [2]. It turns coal into coke for steelmaking by cooking it at very high temperatures [2]. The county health department says a 2022 study found the plant is a significant source of hydrogen sulfide gas [3].
By March 2019, after a December fire damaged pollution controls at Clairton, monitors near the Mon Valley plants had recorded several sulfur dioxide spikes above federal standards [5]. Sulfur dioxide can make breathing problems worse [5]. In January 2026, a control room breakdown at the plant led to raised hydrogen sulfide, sulfur dioxide and PM2.5 readings at the nearby Liberty monitor, during a weak inversion [6].
How did Pittsburgh's smoke history shape clean air laws?
Pittsburgh's smoke and dust were once so thick that streetlights had to be lit at midday [9]. Allegheny County adopted its first air pollution control law in 1949 [9].
In 1948, an inversion settled over Donora, a mill town in a river valley south of Pittsburgh, and trapped pollution for five days [9]. Twenty people died and 6,000 of the town's 14,000 people were sickened [9]. The disaster set off efforts to control air pollution and helped spur the federal Clean Air Act [9] [2]. Richard Nixon signed the Clean Air Act of 1970 [9].
What is being done about Pittsburgh's air?
In September 2021, the Allegheny County Health Department added the Mon Valley Air Pollution Episode Rule to its air regulations [3]. It requires certain plants, including the Clairton Coke Works, to have a plan to cut particle emissions when an air quality warning is declared for the Mon Valley [3]. When high PM2.5 is forecast, the county issues a watch, and the main polluters must have equipment and staff ready to act [7]. If the 24-hour PM2.5 standard is broken and likely to stay broken, a warning orders them to cut polluting activity [8].
The county also fines the Clairton plant. In March 2022 it announced a penalty of 4,570,500 dollars for 831 violations between January 2020 and March 2022, when hot coke was unloaded without filtering its emissions [4]. A December 2023 order for hydrogen sulfide violations carried a penalty of 2,202,825 dollars [3]. U.S. Steel said it disagreed with many points in the 2022 order [4].
How to protect yourself in Pittsburgh
Check the Air Quality Index, or AQI, a color scale that runs from green for good to maroon for hazardous [11]. At orange, people in sensitive groups may feel health effects, and at red some members of the general public may too [11]. Allegheny County lets residents sign up for Allegheny Alerts to get local air quality updates [8].
On days with a Code Red alert for fine particles, the county advises people with breathing conditions, older adults, children, teens and people active outdoors to avoid long or intense outdoor activity [7]. Others should cut back and take more breaks [7]. On Code Orange days, people with asthma should follow their asthma action plan and keep quick-relief medicine on hand [7].
When wildfire smoke arrives, keep windows and doors closed, as US EPA advises [12]. Portable air cleaners and high-efficiency furnace or air conditioning filters, such as those rated MERV 13, can remove particles indoors [12]. Avoid making more particles inside, such as from cooking, smoking or burning candles [12].
Sources
- [1] American Lung Association, New Report: Over 1 Million Pennsylvania Kids Breathe Unhealthy Air; Pittsburgh Metro Area Earns Straight F's for Air Quality as Ozone Smog Worsens and Particle Pollution Shows Mixed Results (April 2026)
- [2] Environmental Health News, Climate change, inversions, and the rise of "super pollution" air events (January 2020)
- [3] Allegheny County Health Department, Clairton Coke Works Legal Matters
- [4] 90.5 WESA, U.S. Steel fined $4.5 million for air pollution in Clairton (March 2022)
- [5] WHYY and StateImpact Pennsylvania, U.S. Steel ordered to clean up sulfur emissions following fire (March 2019)
- [6] Mon Valley Independent (TribLive), Pollution control equipment breaks down at Clairton Coke Works (January 2026)
- [7] Allegheny County Health Department, Code Red Air Quality Alert for Pennsylvania and Mon Valley Watch Issue (July 2026)
- [8] Allegheny County Health Department, Allegheny County Health Department Issues Mon Valley Episode Warning (July 2026)
- [9] 90.5 WESA, The road to the Clean Air Act passes through Pittsburgh (November 2024)
- [10] US Environmental Protection Agency, Particulate Matter (PM) Basics (updated September 2026)
- [11] AirNow (US EPA), AQI Basics
- [12] US Environmental Protection Agency, Wildfires and Indoor Air Quality (IAQ) (updated November 2026)
Last reviewed . The figures in the box at the top update with every new reading; the guide itself is checked against its sources at least once a year, before the city's bad-air season.
Tree cover detail
Tree cover in Pittsburgh: Below target
26.2% tree cover against a 30% healthy-neighborhood target, across 4.1 sq mi (10.68 km²) of land.
Trees in this area
69,963
Target trees
80,110
More trees needed
10,147
CO₂ if planted / yr
223.2 t
Deforestation · 2001–2025
How much forest has Pittsburgh lost?
Since 2001, the area within 10 km of Pittsburgh has lost about 621 acres (252 hectares) of forest (about 470 football fields): 2.2% of the forest it had in 2000. Most of it (90%) was deforestation, forest cleared for good, mainly for towns and roads.
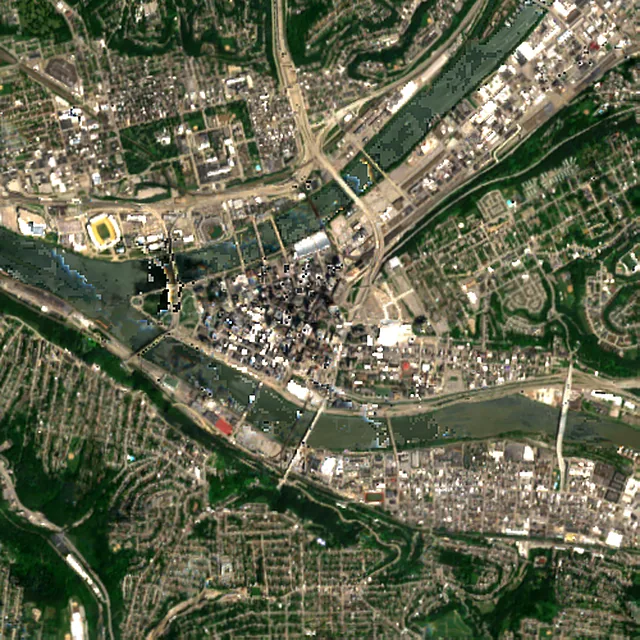
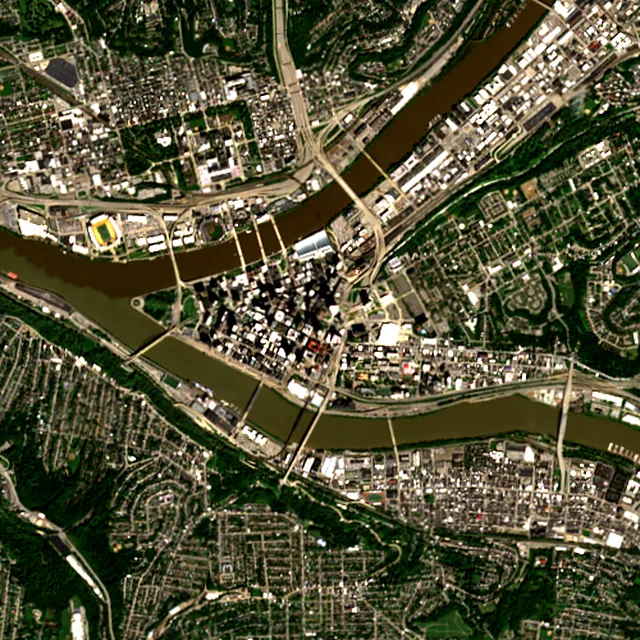

2017: satellite photo from July 2017 of a 5 × 5 km area in the city center.
- Forest lost since 2001
- 621 acres (252 ha)about 470 football fields
- Share of its forest
- 2.2%of what there was in 2000
- Cleared for good
- 557 acres (226 ha)deforestation: turned into farms, mines or towns
The worst year was 2001, when about 83 acres (34 hectares) of forest were lost.
Acres of forest lost each year
Show the figures as a table
| Year | Cleared for good | Can grow back | Total |
|---|---|---|---|
| 2001 | 79 acres (32 ha) | 4 acres (2 ha) | 83 acres (34 ha) |
| 2002 | 45 acres (18 ha) | 3 acres (1 ha) | 48 acres (19 ha) |
| 2003 | 3 acres (1 ha) | under 1 ha | 3 acres (1 ha) |
| 2004 | 35 acres (14 ha) | 4 acres (2 ha) | 39 acres (16 ha) |
| 2005 | 64 acres (26 ha) | 5 acres (2 ha) | 69 acres (28 ha) |
| 2006 | 20 acres (8 ha) | under 1 ha | 20 acres (8 ha) |
| 2007 | 70 acres (29 ha) | 5 acres (2 ha) | 76 acres (31 ha) |
| 2008 | 20 acres (8 ha) | under 1 ha | 22 acres (9 ha) |
| 2009 | 15 acres (6 ha) | 2 acres (1 ha) | 18 acres (7 ha) |
| 2010 | 11 acres (5 ha) | under 1 ha | 13 acres (5 ha) |
| 2011 | 30 acres (12 ha) | under 1 ha | 31 acres (13 ha) |
| 2012 | 8 acres (3 ha) | 4 acres (2 ha) | 11 acres (5 ha) |
| 2013 | 4 acres (2 ha) | under 1 ha | 5 acres (2 ha) |
| 2014 | 6 acres (3 ha) | 3 acres (1 ha) | 9 acres (4 ha) |
| 2015 | 6 acres (2 ha) | under 1 ha | 7 acres (3 ha) |
| 2016 | 23 acres (9 ha) | under 1 ha | 25 acres (10 ha) |
| 2017 | 27 acres (11 ha) | under 1 ha | 29 acres (12 ha) |
| 2018 | 12 acres (5 ha) | 4 acres (2 ha) | 16 acres (6 ha) |
| 2019 | 10 acres (4 ha) | 9 acres (4 ha) | 19 acres (8 ha) |
| 2020 | 5 acres (2 ha) | under 1 ha | 6 acres (2 ha) |
| 2021 | 13 acres (5 ha) | under 1 ha | 15 acres (6 ha) |
| 2022 | 21 acres (8 ha) | under 1 ha | 21 acres (9 ha) |
| 2023 | 19 acres (8 ha) | under 1 ha | 19 acres (8 ha) |
| 2024 | 4 acres (2 ha) | under 1 ha | 4 acres (2 ha) |
| 2025 | 8 acres (3 ha) | 5 acres (2 ha) | 13 acres (5 ha) |
What is causing deforestation around Pittsburgh?
- Towns and roadscleared for good90% · 558 acres (226 ha)
- Loggingcan grow back1.3% · 8 acres (3 ha)
- Unknown causescause unknown8.9% · 56 acres (23 ha)
Causes for 2025 are estimates, based on what caused forest loss in the same places up to 2024.
Forest gained and lost, 2000–2020
- Forest in 2000
- 39,300 acres (15,900 ha)
- Forest in 2020
- 38,900 acres (15,700 ha)
- Overall change
- −381 acres (154 ha)less forest than in 2000
Comparing satellite maps from 2000 and 2020, the forest around Pittsburgh stayed about the same size, at about 38,900 acres (15,700 hectares): new forest grew on about 405 acres (164 hectares), and about 788 acres (319 hectares) were lost.
These 2000 and 2020 maps, from the University of Maryland, count any land with trees taller than 5 m as forest, including plantations and orchards. Forest that was cut or burned and had grown back by 2020 counts in both years, so the loss here is smaller than the yearly figures.
These figures cover everything within 10 km of the city center, a wider area than the report above, because forest is usually lost at a city's edges.
Source: Hansen/UMD/Google/USGS/NASA, Global Forest Change (GFC-2025-v1.13); causes: WRI/Google DeepMind drivers of forest loss; both CC BY 4.0, summed by Airleaf for each area. Forest gained and lost 2000–2020: Potapov et al. 2022, UMD GLAD Global Land Cover and Land Use Change, CC BY 4.0. Images: contains modified Copernicus Sentinel data. How it's measured
In the same region
Measured cities near Pittsburgh
Same 2 km radius, same index — so they compare directly.
- Akron146.7 km
United States
- Tree cover
- 37%
- Air quality
- 70
- Cleveland185.0 km
United States
- Tree cover
- 11%
- Air quality
- 84
- Erie187.9 km
United States
- Tree cover
- 27%
- Air quality
- 12
- Columbus260.5 km
United States
- Tree cover
- 16%
- Air quality
- 85
- Buffalo287.4 km
United States
- Tree cover
- 16%
- Air quality
- 57
- Amherst299.1 km
United States
- Tree cover
- 39%
- Air quality
- 57
Build your own
Compare Pittsburgh with anywhere
This place
Pittsburgh
Use this data
Put Pittsburgh's numbers on your site
Free to embed. Updates itself as the measurement refreshes.

Frequently asked
Questions about Pittsburgh
What is the air quality (AQI) in Pittsburgh right now?
The latest reading for Pittsburgh shows an AQI of 64 (Moderate), measured Nov 11, 09:00 local time by 2 ground monitoring stations via OpenAQ (the median of their readings; the nearest is Lawrenceville, 2.5 mi (4 km) away). The main pollutant is PM2.5. Unusually sensitive people should consider limiting long outdoor exertion.
Is it safe to exercise outside in Pittsburgh today?
At AQI 64 (Moderate): fine for most people; unusually sensitive people should take long or hard exercise easier. Windows: fine to open; close them if you are sensitive to pollution. Masks: not needed for most people. The reading changes through the day, so check again before a long run or ride.
What has the air quality in Pittsburgh been like this week?
Over the last 7 days, the CAMS air-quality model put Pittsburgh's daily AQI at 36 on average, from 22 on Nov 5 to an hourly peak of 78 on Nov 10. No day averaged above 100, the level where the air turns unhealthy for sensitive groups.
Is Pittsburgh's air quality bad?
The American Lung Association's 2026 report, based on 2022 to 2024 data, gave the Pittsburgh metro area failing grades for ozone, short-term particle pollution and year-round particle pollution. It ranked 11th worst in the US for short-term particle spikes.
What is a temperature inversion in Pittsburgh?
It is when a warm layer of air sits above colder air near the ground, trapping pollution that would normally blow away. The Mon Valley south of Pittsburgh is hemmed in by hills, so it is especially prone to this stagnant air.
What is a Mon Valley Episode Watch or Warning?
Under a rule added in 2021, the Allegheny County Health Department issues a watch when bad particle pollution is forecast, so Mon Valley companies can prepare. A warning, issued when the 24-hour PM2.5 standard is exceeded and likely to continue, requires them to temporarily cut polluting activity.
What was the Donora smog?
In 1948, an inversion trapped pollution over Donora, a mill town in a river valley south of Pittsburgh, for five days. Twenty people died and about 6,000 were sickened, and the disaster set off efforts to control air pollution.
Does wildfire smoke reach Pittsburgh?
Yes. In July 2026, smoke from fires in Ontario, Canada, and Minnesota led Pennsylvania to issue a Code Red alert for fine particles, and Allegheny County issued a Mon Valley watch.
How much forest has the area around Pittsburgh lost since 2001?
Since 2001, the area within 10 km of Pittsburgh has lost about 621 acres (252 hectares) of forest (about 470 football fields): 2.2% of the forest it had in 2000. Most of it (90%) was deforestation, forest cleared for good, mainly for towns and roads. Comparing satellite maps from 2000 and 2020, the forest around Pittsburgh stayed about the same size, at about 38,900 acres (15,700 hectares): new forest grew on about 405 acres (164 hectares), and about 788 acres (319 hectares) were lost.
What is the tree count in Pittsburgh?
Pittsburgh has an estimated 69,963 trees across the 4.1 sq mi (10.68 km²) of land measured — 26.2% tree cover, 4 percentage points short of the 30% tree-cover target set for this area.
How many more trees does Pittsburgh need?
Pittsburgh needs roughly 10,147 more trees to close a 4-point shortfall against its 30% tree-cover target — about 223.2 t of extra CO₂ absorbed per year once grown.
How are Pittsburgh's air quality and tree cover measured?
Air quality is measured by ground monitoring stations near Downtown, via OpenAQ; the 7-day trend is the Open-Meteo / CAMS model's estimate. Tree cover is measured from Sentinel-2 L2A (ESA Copernicus) via Earth Search satellite imagery at 10 m detail across a 1.2 mi (2 km) radius around Downtown; the tree count is an estimate derived from that cover.
See your own area
What does your neighborhood look like?
Pick any point and radius to get the same air-quality and tree-cover breakdown.
Check my address