City report · New York, United States
New York Air quality today
Air quality in New York currently reads AQI 76 (Moderate): Unusually sensitive people should consider limiting long outdoor exertion.
Air quality right now
AQI 76
Moderate
- PM2.5, fine particles (µg/m³)
- 6.7
- tree cover
- 14.9%
- trees in this area
- 24.2K
- more trees needed
- 24.5K
Measured across a 1.2 mi (2 km) radius around Civic Center, New York, NY, USA (4.9 sq mi), from a satellite image of Sep 8, 2026. Lower AQI is better: 0–50 is Good, above 300 is Hazardous.
New York · AQI 76 (Moderate)
New York's tree count comes to 24,154 trees across 2.5 sq mi (6.49 km²) of land, 15 points below the 30% tree-cover level considered healthy for this area, so roughly 24,478 more trees would close the gap.
Air quality detail
Air quality in New York today: AQI 76, Moderate
Main pollutant: NO₂ · Observed Nov 11, 09:00 local time via OpenAQ ground stations, US EPA index. Values in µg/m³.
Ground station · Jersey City FH, 2.5 mi (4.1 km) away · median of 6 stations
Health signal
Unusually sensitive people should consider limiting long outdoor exertion.
PM2.5
6.7
PM10
—
NO₂
144.9
O₃
—
SO₂
10.5
CO
—
Data: OpenAQ · AirNow
- Outdoor exercise
- Fine for most people; unusually sensitive people should take long or hard exercise easier
- Windows
- Fine to open; close them if you are sensitive to pollution
- Mask
- Not needed for most people
- Air purifier
- Worth running if you are sensitive
Over the last 7 days, the CAMS air-quality model put New York's daily AQI at 45 on average, from 28 on Nov 8 to an hourly peak of 107 on Nov 6.
Where New York stands: the most polluted cities in the world right now · the cleanest
City air guide
Why does New York's air get unhealthy?
Right now
- Today's AQI in New York is 76, moderate, mostly from NO₂.
- Over the past 7 days, the daily average was 45.
Common sources of New York's air pollution include fuel burned in vehicles and building boilers, construction equipment, ships and restaurant grills [1]. In summer, sunlight turns some of that pollution into ozone smog, and the 2026 State of the Air report ranked the New York metro area 12th worst in the US for ozone [1][4]. Wildfire smoke can also drift in from Canada, as it did in June 2023, when the city's fine particle readings set records [2][3].
Where does New York's air pollution come from?
One key pollutant is PM2.5: tiny particles less than 2.5 microns across, small enough to get deep into the lungs and the bloodstream [1]. In New York City, common sources include fuel burned in vehicles, building boilers, power plants, construction equipment, ships and commercial cooking [1].
Not all of it is local. The city health department says 20% to 30% of the PM2.5 in the city's air comes from upwind areas, such as coal-burning power plants in the Midwest [1]. Nitrogen dioxide, a gas from burning fuel, comes from motor vehicles, buildings, ships and construction equipment [1].
Which neighborhoods have the dirtiest air?
Pollution is higher in places with many warehouses and truck traffic, many restaurant grills and charbroilers, and dense traffic and buildings [1]. The health department names warehouse areas such as Newtown Creek in Queens and Brooklyn, the area near JFK airport, Red Hook and Sunset Park in Brooklyn, and Hunts Point in the Bronx [1].
Ozone works the other way. The city's monitors find more ozone in places with less traffic, such as outer Queens, Brooklyn and Staten Island, and less of it near busy roads and in midtown Manhattan [1].
Why is summer ozone a problem?
Ground-level ozone is the main ingredient in smog. It is not released directly; it forms when pollution from cars, power plants and industry reacts in sunlight [5]. It is most likely to reach unhealthy levels on hot, sunny days in cities [5], and the city health department says ozone levels are higher in summer [1].
In the American Lung Association's 2026 State of the Air report, based on 2022 to 2024 data, the New York metro area ranked 12th worst in the US for ozone, with an F grade [4]. Its worst county, Fairfield County in Connecticut, averaged 21.2 unhealthy ozone days a year, worse than the 16th worst ranking in the 2025 report [4].
What happened during the June 2023 wildfire smoke?
In the first week of June 2023, smoke from fires in Quebec poured south into the eastern US [2]. Winds usually carry that smoke out to sea, but in June 2023 a persistent coastal low pressure system near Prince Edward Island steered it south [2]. On June 6, the air quality index for PM2.5 in New York City passed 175, beating the previous record of 167 set in 2002 [2].
The city's Public Advocate reported that on June 7, 2023, the daily average PM2.5 level reached a record 117 micrograms per cubic meter, over eight times the WHO standard it cites, and the air quality index reached a record 484 [3]. The same report counted 175 asthma emergency room visits in the city on June 6 and 317 on June 7 [3].
Is New York's air getting better?
Yes, for most pollutants. The city's street-level monitoring program, run with Queens College since December 2008, found that average PM2.5 fell 36% and nitrogen dioxide fell 41% between 2009 and 2024 [1]. Air quality improved a lot after rules required buildings to switch to cleaner heating oil by 2015 [1].
In the 2026 State of the Air report, the New York metro area posted its best result yet for year-round particle pollution, earning a passing grade [4]. Ozone has shown no consistent trend in city monitoring, and the health department says it may trend higher as average temperatures rise with climate change [1].
The city's sustainability plan, PlaNYC, aims to cut emissions from restaurant charbroiling, get the most polluting trucks off the streets and speed up the phase-out of fossil fuel burning in buildings [1].
How to protect yourself in New York
Check the daily air quality forecast before you plan your day; EPA points people to AirNow for ozone and other daily readings [5]. On smoky days, avoid hard exercise outdoors, such as running, and wait until the air improves before being active outside [6].
When wildfire smoke arrives, the US EPA advises staying inside with doors and windows closed, setting air conditioning to recirculate, and using a portable air cleaner sized for the room that makes little or no ozone [6]. Set up one cleaner air room for the household, and avoid adding indoor pollution from candles, incense, gas or wood-burning stoves, smoking, vaping or high heat cooking [6].
If you must go outside in heavy smoke, the EPA says a well fitted N95 respirator reduces your exposure to fine particles, and it advises not to rely on dust masks or bandanas [6]. If you have heart or lung disease, follow your health care provider's advice, and if you have asthma, follow your asthma management plan [6].
Sources
- [1] NYC Department of Health, Environment and Health Data Portal, NYC Community Air Survey Annual Report
- [2] NASA Earth Observatory, Smoke Smothers the Northeast (June 2023)
- [3] NYC Public Advocate, Orange Sky, Red Alert: A Review of Air Quality Emergencies in NYC (July 2023)
- [4] American Lung Association, New Report: Over 1 Million Children in NY State Breathe Some of the Nation's Most Polluted Air; New York-Newark Metro Sees Worsening Ozone Smog While Particle Pollution Improves on Both Measures (April 2026)
- [5] US Environmental Protection Agency, Ground-level Ozone Basics (February 2026)
- [6] US Environmental Protection Agency, Reduce Your Smoke Exposure (July 2026)
Last reviewed . The figures in the box at the top update with every new reading; the guide itself is checked against its sources at least once a year, before the city's bad-air season.
Tree cover detail
Tree cover in New York: Critically low
14.9% tree cover against a 30% healthy-neighborhood target, across 2.5 sq mi (6.49 km²) of land.
Trees in this area
24,154
Target trees
48,632
More trees needed
24,478
CO₂ if planted / yr
538.5 t
Deforestation · 2001–2025
How much forest has New York lost?
Since 2001, the area within 10 km of New York has lost about 94 acres (38 hectares) of forest (about 71 football fields): 3.6% of the forest it had in 2000. Most of it (87%) was deforestation, forest cleared for good, mainly for towns and roads.
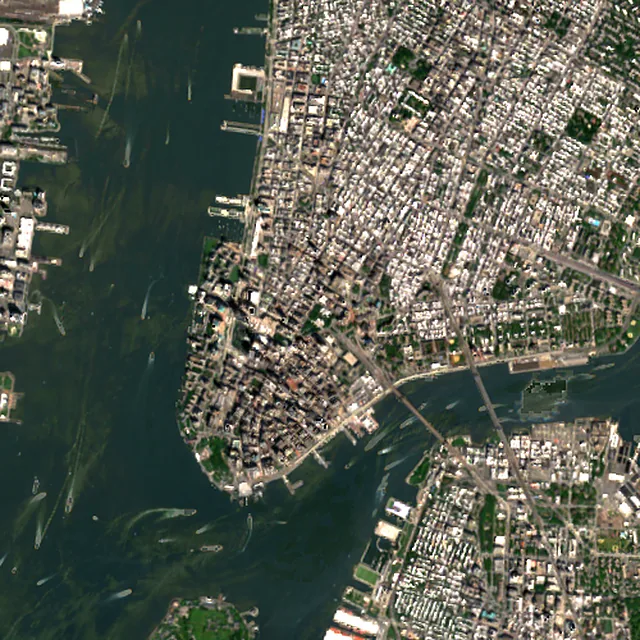
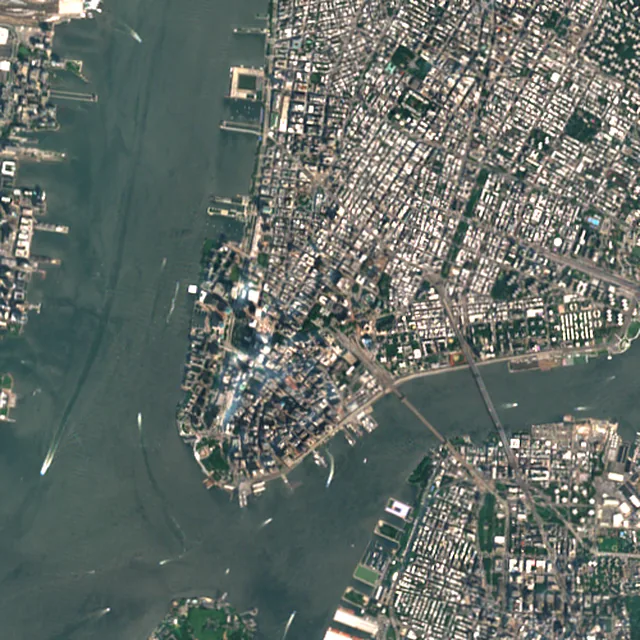

2017: satellite photo from July 2017 of a 5 × 5 km area in the city center.
- Forest lost since 2001
- 94 acres (38 ha)about 71 football fields
- Share of its forest
- 3.6%of what there was in 2000
- Cleared for good
- 83 acres (33 ha)deforestation: turned into farms, mines or towns
The worst year was 2023, when about 28 acres (11 hectares) of forest were lost.
Acres of forest lost each year
Show the figures as a table
| Year | Cleared for good | Can grow back | Total |
|---|---|---|---|
| 2001 | under 1 ha | under 1 ha | under 1 ha |
| 2002 | under 1 ha | under 1 ha | under 1 ha |
| 2003 | under 1 ha | under 1 ha | under 1 ha |
| 2004 | under 1 ha | under 1 ha | 3 acres (1 ha) |
| 2005 | under 1 ha | under 1 ha | 3 acres (1 ha) |
| 2006 | under 1 ha | under 1 ha | under 1 ha |
| 2007 | 2 acres (1 ha) | under 1 ha | 3 acres (1 ha) |
| 2008 | 5 acres (2 ha) | under 1 ha | 6 acres (3 ha) |
| 2009 | 4 acres (2 ha) | under 1 ha | 5 acres (2 ha) |
| 2010 | 7 acres (3 ha) | under 1 ha | 9 acres (4 ha) |
| 2011 | under 1 ha | under 1 ha | under 1 ha |
| 2012 | under 1 ha | under 1 ha | under 1 ha |
| 2013 | under 1 ha | under 1 ha | under 1 ha |
| 2014 | under 1 ha | under 1 ha | under 1 ha |
| 2015 | under 1 ha | under 1 ha | under 1 ha |
| 2016 | 4 acres (2 ha) | under 1 ha | 4 acres (2 ha) |
| 2017 | under 1 ha | under 1 ha | under 1 ha |
| 2018 | under 1 ha | under 1 ha | under 1 ha |
| 2019 | under 1 ha | under 1 ha | under 1 ha |
| 2020 | under 1 ha | under 1 ha | under 1 ha |
| 2021 | under 1 ha | under 1 ha | under 1 ha |
| 2022 | under 1 ha | under 1 ha | under 1 ha |
| 2023 | 28 acres (11 ha) | under 1 ha | 28 acres (11 ha) |
| 2024 | 20 acres (8 ha) | under 1 ha | 20 acres (8 ha) |
| 2025 | under 1 ha | under 1 ha | under 1 ha |
What is causing deforestation around New York?
- Towns and roadscleared for good87% · 82 acres (33 ha)
- Unknown causescause unknown12% · 11 acres (5 ha)
Causes for 2025 are estimates, based on what caused forest loss in the same places up to 2024.
Forest gained and lost, 2000–2020
- Forest in 2000
- 5,130 acres (2,080 ha)
- Forest in 2020
- 5,420 acres (2,190 ha)
- Overall change
- +289 acres (117 ha)more forest than in 2000
Comparing satellite maps from 2000 and 2020, the forest around New York grew from about 5,130 acres (2,080 hectares) to 5,420 acres (2,190 hectares), a net gain of about 289 acres (117 hectares) (+5.6%). New forest grew on about 425 acres (172 hectares), while 134 acres (54 hectares) were lost.
These 2000 and 2020 maps, from the University of Maryland, count any land with trees taller than 5 m as forest, including plantations and orchards. Forest that was cut or burned and had grown back by 2020 counts in both years, so the loss here is smaller than the yearly figures.
These figures cover everything within 10 km of the city center, a wider area than the report above, because forest is usually lost at a city's edges.
Source: Hansen/UMD/Google/USGS/NASA, Global Forest Change (GFC-2025-v1.13); causes: WRI/Google DeepMind drivers of forest loss; both CC BY 4.0, summed by Airleaf for each area. Forest gained and lost 2000–2020: Potapov et al. 2022, UMD GLAD Global Land Cover and Land Use Change, CC BY 4.0. Images: contains modified Copernicus Sentinel data. How it's measured
In the same region
Measured cities near New York
Same 2 km radius, same index — so they compare directly.
- Newark14.3 km
United States
- Tree cover
- 11%
- Air quality
- 56
- Queens14.7 km
United States
- Tree cover
- 12%
- Air quality
- 32
- Elizabeth18.1 km
United States
- Tree cover
- 15%
- Air quality
- 31
- The Bronx19.2 km
United States
- Tree cover
- 30%
- Air quality
- 26
- Staten Island20.2 km
United States
- Tree cover
- 43%
- Air quality
- 54
- Yonkers25.8 km
United States
- Tree cover
- 46%
- Air quality
- 23
Also compared:New York vs Los AngelesNew York vs WashingtonNew York vs ChicagoNew York vs Houston
Build your own
Compare New York with anywhere
This place
New York
Use this data
Put New York's numbers on your site
Free to embed. Updates itself as the measurement refreshes.
Frequently asked
Questions about New York
What is the air quality (AQI) in New York right now?
The latest reading for New York shows an AQI of 76 (Moderate), measured Nov 11, 09:00 local time by 6 ground monitoring stations via OpenAQ (the median of their readings; the nearest is Jersey City FH, 2.5 mi (4.1 km) away). The main pollutant is NO₂. Unusually sensitive people should consider limiting long outdoor exertion.
Is it safe to exercise outside in New York today?
At AQI 76 (Moderate): fine for most people; unusually sensitive people should take long or hard exercise easier. Windows: fine to open; close them if you are sensitive to pollution. Masks: not needed for most people. The reading changes through the day, so check again before a long run or ride.
What has the air quality in New York been like this week?
Over the last 7 days, the CAMS air-quality model put New York's daily AQI at 45 on average, from 28 on Nov 8 to an hourly peak of 107 on Nov 6. No day averaged above 100, the level where the air turns unhealthy for sensitive groups.
What causes air pollution in New York City?
Common sources include fuel burned in vehicles, building boilers, power plants, construction equipment and ships, plus restaurant grills and charbroilers. Some fine particle pollution also blows in from upwind areas such as the Midwest.
When is New York's air worst?
Ozone smog builds on hot, sunny days, and the city health department says ozone levels are higher in summer. Wildfire smoke from Canada can also cause very bad days, as it did in early June 2023.
How bad was the air in New York in June 2023?
Fine particle readings set records. The air quality index for fine particles passed its previous record on June 6, 2023, and the city's Public Advocate reported a record index reading of 484 on June 7.
Is New York's air quality improving?
For most pollutants, yes. City monitoring found fine particles fell 36% and nitrogen dioxide fell 41% between 2009 and 2024. Ozone has not shown a steady trend, and the metro area got an F for ozone in the 2026 State of the Air report.
How much forest has the area around New York lost since 2001?
Since 2001, the area within 10 km of New York has lost about 94 acres (38 hectares) of forest (about 71 football fields): 3.6% of the forest it had in 2000. Most of it (87%) was deforestation, forest cleared for good, mainly for towns and roads. Comparing satellite maps from 2000 and 2020, the forest around New York grew from about 5,130 acres (2,080 hectares) to 5,420 acres (2,190 hectares), a net gain of about 289 acres (117 hectares) (+5.6%). New forest grew on about 425 acres (172 hectares), while 134 acres (54 hectares) were lost.
What is the tree count in New York?
New York has an estimated 24,154 trees across the 2.5 sq mi (6.49 km²) of land measured — 14.9% tree cover, 15 percentage points short of the 30% tree-cover target set for this area.
How many more trees does New York need?
New York needs roughly 24,478 more trees to close a 15-point shortfall against its 30% tree-cover target — about 538.5 t of extra CO₂ absorbed per year once grown.
How are New York's air quality and tree cover measured?
Air quality is measured by ground monitoring stations near Civic Center, via OpenAQ; the 7-day trend is the Open-Meteo / CAMS model's estimate. Tree cover is measured from Sentinel-2 L2A (ESA Copernicus) via Earth Search satellite imagery at 10 m detail across a 1.2 mi (2 km) radius around Civic Center; the tree count is an estimate derived from that cover.
See your own area
What does your neighborhood look like?
Pick any point and radius to get the same air-quality and tree-cover breakdown.
Check my address