City report · California, United States
Los Angeles Air quality today
Air quality in Los Angeles currently reads AQI 39 (Good): Air quality is satisfactory for everyone.
Air quality right now
AQI 39
Good
- PM2.5, fine particles (µg/m³)
- 7.1
- tree cover
- 4.5%
- trees in this area
- 14.1K
- more trees needed
- 80.0K
Measured across a 1.2 mi (2 km) radius around Downtown Los Angeles, Los Angeles, CA, USA (4.9 sq mi), from a satellite image of Sep 14, 2026. Lower AQI is better: 0–50 is Good, above 300 is Hazardous.
Los Angeles · AQI 39 (Good)
Los Angeles's tree count comes to 14,123 trees across 4.8 sq mi (12.56 km²) of land, 26 points below the 30% tree-cover level considered healthy for this area, so roughly 80,030 more trees would close the gap.
Air quality detail
Air quality in Los Angeles today: AQI 39, Good
Main pollutant: PM2.5 · Observed Nov 11, 07:00 local time via OpenAQ ground stations, US EPA index. Values in µg/m³.
Ground station · Roybal LC (8544), 0.9 mi (1.5 km) away · median of 51 stations
Health signal
Air quality is satisfactory for everyone.
PM2.5
7.1
PM10
31.0
NO₂
73.4
O₃
2.0
SO₂
1.1
CO
572.8
Data: OpenAQ · AirGradient, AirNow, Clarity, swamphag, P8Burns, Erkki, BirdNest, Frank Harper
- Outdoor exercise
- A good day to be active outside
- Windows
- Open them to air the house
- Mask
- Not needed
- Air purifier
- Not needed
Over the last 7 days, the CAMS air-quality model put Los Angeles's daily AQI at 57 on average, from 46 on Nov 7 to an hourly peak of 83 on Nov 4.
Where Los Angeles stands: the most polluted cities in the world right now · the cleanest
City air guide
Why is the air in Los Angeles so bad?
Right now
- Today's AQI in Los Angeles is 39, good, mostly from PM2.5.
- Over the past 7 days, the daily average was 57.
- Los Angeles's air is usually worst for ozone from April to October.
The regional air district says the Los Angeles basin has some of the worst air quality in the nation [2]. Ozone, the main part of smog, forms when pollution from vehicles, industry and other sources reacts in sunlight, and the region's weather and mountains trap it [2]. In the American Lung Association's 2026 report, Los Angeles-Long Beach again ranked as the most ozone-polluted city in the nation [1]. Wildfire smoke adds sudden spikes, as in January 2025 [4].
Why does Los Angeles get so much smog?
Ozone is a gas that forms in the air when two kinds of pollution, nitrogen oxides and volatile organic compounds, react in sunlight [2]. These come from many sources, including vehicles, consumer products, industry and plants [2]. Ground-level ozone is also known as smog [1].
The area is the nation's second largest urban area, and it puts out a large amount of emissions [2]. Low winds slow their spread, and frequent strong temperature inversions form a cap that traps them close to the ground [2]. The surrounding mountains trap pollution further as the sea breeze pushes it inland, and abundant sunshine drives the reactions that form ozone [2].
When is the air worst in Los Angeles?
High ozone is typically seen from April through October, when days are longer and sunlight is stronger [2]. The highest levels usually come on the hottest summer days, because the reactions run faster in heat [2]. The local air district marks May as the start of smog season, which officially ends on September 30, though high ozone may persist into the fall [3].
Ozone often reaches unhealthy levels in the afternoon, especially in inland areas [3]. In 2020, coastal areas saw the fewest days over the federal ozone standard, because the sea breeze carries pollution inland before it turns into ozone [2]. Ozone rose toward the Riverside and San Bernardino County valleys and nearby mountains [2].
Fine particles, called PM2.5 because they are less than 2.5 microns across, can be high at any time of year [2]. They tend to peak most often in fall and winter, when still air traps pollution [2].
How bad is it compared with the rest of the US?
In the American Lung Association's 2026 State of the Air report, based on 2022 to 2024 data, Los Angeles-Long Beach ranked as the most ozone-polluted city in the US, with 159.2 unhealthy ozone days a year [1]. It ranked 7th worst for year-round particle pollution, and 7th for short-term particle spikes, with 13 unhealthy days a year [1].
There is progress too. The same report lists Los Angeles among seven California communities that reached their lowest annual particle pollution levels [1].
In its 2022 plan, the regional air district noted that the Los Angeles basin and the San Joaquin Valley were the only areas with an extreme rating for failing the federal 2015 ozone standard [2].
How does wildfire smoke affect Los Angeles?
The Palisades and Eaton fires both began on January 7, 2025 [5]. In a January 9, 2025 advisory, the air district reported PM2.5 levels from Unhealthy for Sensitive Groups up to Hazardous in Malibu, Pacific Palisades and central and southwest Los Angeles County [4]. Gusty Santa Ana winds also contributed to high levels of windblown dust and ash [4].
Air monitors in the smoke plume from January 7 to 11, 2025 found highly elevated toxic metals such as arsenic and lead, even compared with other fires in the region that burned in non-urban areas [5]. After January 12, these metals dropped sharply, to levels generally similar to before the fires [5].
The air district also says the region had unusually high ozone in 2020 because of record-breaking heatwaves and wildfires [2].
What is being done about it?
The South Coast Air Quality Management District is the agency responsible for improving air quality across large parts of Los Angeles, Orange, Riverside and San Bernardino counties [3]. Its 2022 Air Quality Management Plan is focused on strategies to meet the federal 2015 ozone standard [2].
After the January 2025 fires, the district ran a 19-week expanded air monitoring effort at the Eaton and Palisades burn areas, testing for particles, toxic metals and asbestos [5]. It reported that results did not show levels of concern, even during peak debris removal, and it ended this monitoring on July 8, 2025 [5].
How to protect yourself in Los Angeles
During smog season, check the AQI, a daily air quality score, to plan outdoor exercise [3]. On unhealthy days, limit outdoor activity, especially in the afternoon when ozone peaks, and avoid heavy exertion near busy roads [3]. Young children, older adults, pregnant people and people with chronic breathing conditions may feel effects even at low pollution levels [3].
When wildfire smoke drifts in, US EPA advice is to stay inside with the doors and windows closed and use a portable air cleaner powerful enough for the room [6]. Choose one that makes little or no ozone [6]. Avoid adding to indoor pollution: skip candles, incense, fireplaces and cooking at high heat [6].
If you must be outside in smoke, EPA says a snug-fitting N95 respirator reduces your exposure to the fine particles, and that dust masks and bandanas should not be relied on [6]. Avoid strenuous activity and wait until the air is better before being active outdoors [6].
Sources
- [1] American Lung Association, California Clean Air Progress at Risk: Lung Association State of the Air Highlights Local Pollution Progress and Challenges (April 2026)
- [2] South Coast Air Quality Management District, 2022 Air Quality Management Plan, Chapter 2: Air Quality and Health Effects (2022)
- [3] South Coast Air Quality Management District, Summer Smog Season is Here (May 2026)
- [4] South Coast Air Quality Management District, South Coast AQMD Extends Smoke Advisory through Friday for Northwest Los Angeles County Due to Wildfires (January 2025)
- [5] South Coast Air Quality Management District, 2025 Wildfire Response
- [6] US Environmental Protection Agency, Reduce Your Smoke Exposure (updated July 2026)
Last reviewed . The figures in the box at the top update with every new reading; the guide itself is checked against its sources at least once a year, before the city's bad-air season.
Tree cover detail
Tree cover in Los Angeles: Critically low
4.5% tree cover against a 30% healthy-neighborhood target, across 4.8 sq mi (12.56 km²) of land.
Trees in this area
14,123
Target trees
94,153
More trees needed
80,030
CO₂ if planted / yr
1,761 t
Deforestation · 2001–2025
How much forest has Los Angeles lost?
Since 2001, the area within 10 km of Los Angeles has lost about 304 acres (123 hectares) of forest (about 230 football fields): 53% of the forest it had in 2000. Most of it was lost to wildfires, so much of it can grow back. About 9 acres (4 hectares) (2.8%) was deforestation: forest cleared for good for farms, mines or towns.
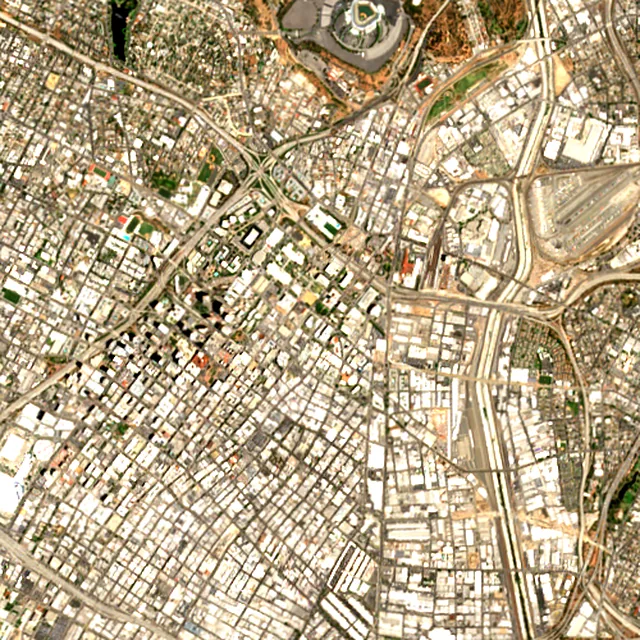
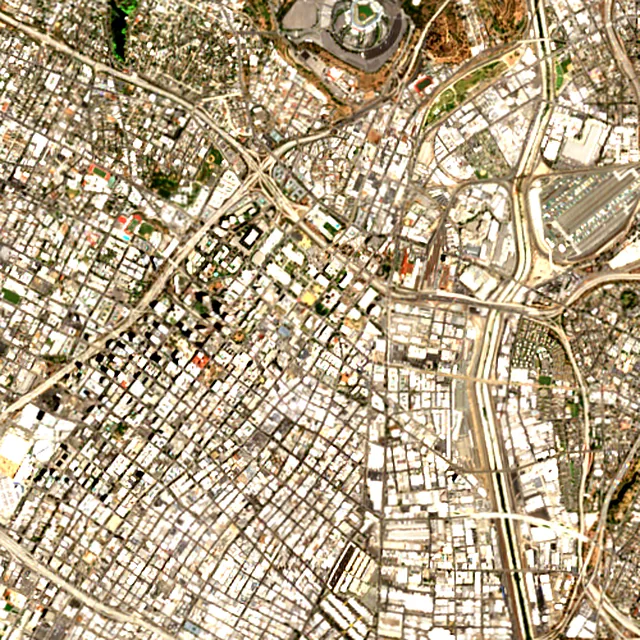

2017: satellite photo from July 2017 of a 5 × 5 km area in the city center.
- Forest lost since 2001
- 304 acres (123 ha)about 230 football fields
- Share of its forest
- 53%of what there was in 2000
- Cleared for good
- 9 acres (4 ha)deforestation: turned into farms, mines or towns
The worst year was 2007, when about 289 acres (117 hectares) of forest were lost, mostly to wildfires.
Acres of forest lost each year
Show the figures as a table
| Year | Cleared for good | Can grow back | Total |
|---|---|---|---|
| 2001 | under 1 ha | under 1 ha | under 1 ha |
| 2002 | under 1 ha | under 1 ha | under 1 ha |
| 2003 | under 1 ha | under 1 ha | under 1 ha |
| 2004 | under 1 ha | under 1 ha | under 1 ha |
| 2005 | under 1 ha | under 1 ha | under 1 ha |
| 2006 | 4 acres (2 ha) | under 1 ha | 5 acres (2 ha) |
| 2007 | under 1 ha | 289 acres (117 ha) | 289 acres (117 ha) |
| 2008 | under 1 ha | under 1 ha | under 1 ha |
| 2009 | under 1 ha | under 1 ha | under 1 ha |
| 2010 | under 1 ha | under 1 ha | under 1 ha |
| 2011 | under 1 ha | under 1 ha | under 1 ha |
| 2012 | under 1 ha | under 1 ha | under 1 ha |
| 2013 | under 1 ha | under 1 ha | under 1 ha |
| 2014 | under 1 ha | under 1 ha | under 1 ha |
| 2015 | under 1 ha | under 1 ha | under 1 ha |
| 2016 | under 1 ha | under 1 ha | under 1 ha |
| 2017 | under 1 ha | under 1 ha | under 1 ha |
| 2018 | under 1 ha | 2 acres (1 ha) | 2 acres (1 ha) |
| 2019 | under 1 ha | under 1 ha | under 1 ha |
| 2020 | under 1 ha | under 1 ha | under 1 ha |
| 2021 | under 1 ha | under 1 ha | under 1 ha |
| 2022 | under 1 ha | under 1 ha | under 1 ha |
| 2023 | under 1 ha | under 1 ha | under 1 ha |
| 2024 | under 1 ha | under 1 ha | under 1 ha |
| 2025 | under 1 ha | under 1 ha | under 1 ha |
What is causing deforestation around Los Angeles?
- Wildfirescan grow back96% · 292 acres (118 ha)
- Towns and roadscleared for good2.8% · 9 acres (4 ha)
- Unknown causescause unknown1.2% · 4 acres (2 ha)
Causes for 2025 are estimates, based on what caused forest loss in the same places up to 2024.
Forest gained and lost, 2000–2020
- Forest in 2000
- 3,830 acres (1,550 ha)
- Forest in 2020
- 3,840 acres (1,550 ha)
- Overall change
- +10 acres (4 ha)more forest than in 2000
Comparing satellite maps from 2000 and 2020, the forest around Los Angeles stayed about the same size, at about 3,840 acres (1,550 hectares): new forest grew on about 93 acres (38 hectares), and about 84 acres (34 hectares) were lost.
These 2000 and 2020 maps, from the University of Maryland, count any land with trees taller than 5 m as forest, including plantations and orchards. Forest that was cut or burned and had grown back by 2020 counts in both years, so the loss here is smaller than the yearly figures.
These figures cover everything within 10 km of the city center, a wider area than the report above, because forest is usually lost at a city's edges.
Source: Hansen/UMD/Google/USGS/NASA, Global Forest Change (GFC-2025-v1.13); causes: WRI/Google DeepMind drivers of forest loss; both CC BY 4.0, summed by Airleaf for each area. Forest gained and lost 2000–2020: Potapov et al. 2022, UMD GLAD Global Land Cover and Land Use Change, CC BY 4.0. Images: contains modified Copernicus Sentinel data. How it's measured
In the same region
Measured cities near Los Angeles
Same 2 km radius, same index — so they compare directly.
- Pasadena14.0 km
United States
- Tree cover
- 26%
- Air quality
- 26
- Inglewood14.2 km
United States
- Tree cover
- 11%
- Air quality
- 50
- Burbank15.5 km
United States
- Tree cover
- 15%
- Air quality
- 34
- Downey16.1 km
United States
- Tree cover
- 11%
- Air quality
- 55
- Compton17.5 km
United States
- Tree cover
- 7%
- Air quality
- 65
- El Monte20.0 km
United States
- Tree cover
- 9%
- Air quality
- 33
Also compared:Los Angeles vs New YorkLos Angeles vs WashingtonLos Angeles vs ChicagoLos Angeles vs Houston
Build your own
Compare Los Angeles with anywhere
This place
Los Angeles
Use this data
Put Los Angeles's numbers on your site
Free to embed. Updates itself as the measurement refreshes.
Frequently asked
Questions about Los Angeles
What is the air quality (AQI) in Los Angeles right now?
The latest reading for Los Angeles shows an AQI of 39 (Good), measured Nov 11, 07:00 local time by 51 ground monitoring stations via OpenAQ (the median of their readings; the nearest is Roybal LC (8544), 0.9 mi (1.5 km) away). The main pollutant is PM2.5. Air quality is satisfactory for everyone.
Is it safe to exercise outside in Los Angeles today?
At AQI 39 (Good): a good day to be active outside. Windows: open them to air the house. Masks: not needed. The reading changes through the day, so check again before a long run or ride.
What has the air quality in Los Angeles been like this week?
Over the last 7 days, the CAMS air-quality model put Los Angeles's daily AQI at 57 on average, from 46 on Nov 7 to an hourly peak of 83 on Nov 4. No day averaged above 100, the level where the air turns unhealthy for sensitive groups.
Why is the air quality in Los Angeles so bad?
The nation's second largest urban area puts out a large amount of emissions, and sunlight turns them into ozone. Light winds, frequent temperature inversions and the surrounding mountains trap the pollution close to the ground and keep it from clearing.
When is smog worst in Los Angeles?
High ozone is typically seen from April through October, peaking on hot, sunny afternoons, especially inland. The local air district treats May through September as the official smog season.
Does Los Angeles have the worst ozone in the US?
In the American Lung Association's 2026 State of the Air report, based on 2022 to 2024 data, Los Angeles-Long Beach ranked as the most ozone-polluted city in the nation, with 159.2 unhealthy ozone days a year.
How did the January 2025 wildfires affect air in Los Angeles?
The Palisades and Eaton fires began on January 7, 2025. Smoke pushed fine particle levels as high as the Hazardous range in parts of Los Angeles County, and monitors in the smoke plume found highly elevated toxic metals such as arsenic and lead from January 7 to 11.
How much forest has the area around Los Angeles lost since 2001?
Since 2001, the area within 10 km of Los Angeles has lost about 304 acres (123 hectares) of forest (about 230 football fields): 53% of the forest it had in 2000. Most of it was lost to wildfires, so much of it can grow back. About 9 acres (4 hectares) (2.8%) was deforestation: forest cleared for good for farms, mines or towns. Comparing satellite maps from 2000 and 2020, the forest around Los Angeles stayed about the same size, at about 3,840 acres (1,550 hectares): new forest grew on about 93 acres (38 hectares), and about 84 acres (34 hectares) were lost.
What is the tree count in Los Angeles?
Los Angeles has an estimated 14,123 trees across the 4.8 sq mi (12.56 km²) of land measured — 4.5% tree cover, 26 percentage points short of the 30% tree-cover target set for this area.
How many more trees does Los Angeles need?
Los Angeles needs roughly 80,030 more trees to close a 26-point shortfall against its 30% tree-cover target — about 1,761 t of extra CO₂ absorbed per year once grown.
How are Los Angeles's air quality and tree cover measured?
Air quality is measured by ground monitoring stations near Downtown Los Angeles, via OpenAQ; the 7-day trend is the Open-Meteo / CAMS model's estimate. Tree cover is measured from Sentinel-2 L2A (ESA Copernicus) via Earth Search satellite imagery at 10 m detail across a 1.2 mi (2 km) radius around Downtown Los Angeles; the tree count is an estimate derived from that cover.
See your own area
What does your neighborhood look like?
Pick any point and radius to get the same air-quality and tree-cover breakdown.
Check my address