City report · Arizona, United States
Phoenix Air quality today
Air quality in Phoenix currently reads AQI 67 (Moderate): Unusually sensitive people should consider limiting long outdoor exertion.
Air quality right now
AQI 67
Moderate
- PM2.5, fine particles (µg/m³)
- 17.9
- tree cover
- 2.5%
- trees in this area
- 7.9K
- more trees needed
- 86.4K
Measured across a 1.2 mi (2 km) radius around Downtown Phoenix, Phoenix, AZ, USA (4.9 sq mi), from a satellite image of Sep 13, 2026. Lower AQI is better: 0–50 is Good, above 300 is Hazardous.
Phoenix · AQI 67 (Moderate)
Phoenix's tree count comes to 7,854 trees across 4.9 sq mi (12.57 km²), 27 points below the 30% tree-cover level considered healthy for this area, so roughly 86,394 more trees would close the gap.
Air quality detail
Air quality in Phoenix today: AQI 67, Moderate
Main pollutant: PM2.5 · Observed Nov 11, 07:00 local time via OpenAQ ground stations, US EPA index. Values in µg/m³.
Ground station · Phoenix JLG Supersit, 4.0 mi (6.4 km) away · median of 6 stations
Health signal
Unusually sensitive people should consider limiting long outdoor exertion.
PM2.5
17.9
PM10
34.0
NO₂
35.8
O₃
2.0
SO₂
1.3
CO
572.8
Data: OpenAQ · AirNow
- Outdoor exercise
- Fine for most people; unusually sensitive people should take long or hard exercise easier
- Windows
- Fine to open; close them if you are sensitive to pollution
- Mask
- Not needed for most people
- Air purifier
- Worth running if you are sensitive
Over the last 7 days, the CAMS air-quality model put Phoenix's daily AQI at 55 on average, from 44 on Nov 7 to an hourly peak of 97 on Nov 4.
Where Phoenix stands: the most polluted cities in the world right now · the cleanest
City air guide
Why does Phoenix have so much ozone and dust?
Right now
- Today's AQI in Phoenix is 67, moderate, mostly from PM2.5.
- Over the past 7 days, the daily average was 55.
- November is in Phoenix's usual season for wood smoke and fine particles (November to February), so expect bad days to come and go until it ends.
Phoenix's air has two problems at two times of year. From April through September, the sun and heat turn exhaust into ozone, and the American Lung Association ranks the Phoenix area 4th worst in the US for it [1][3]. In the cooler months, still air traps wood smoke and fine particles close to the ground [2]. Dust adds to both, from construction and dirt roads and from the summer's thunderstorm-driven dust storms [1][4].
Why is ozone so bad in Phoenix?
Ozone isn't released directly. It forms when gases from tailpipes, smokestacks and factories react in sunlight, so a hot, sunny city makes a lot of it [3]. April through September is Maricopa County's ozone season [1].
In the Lung Association's 2026 report, Maricopa County averaged 58.2 days a year of unhealthy ozone in 2022–2024, the 4th worst record in the country [3].
Why does winter bring smoky air?
Cooler weather can create temperature inversions, where a layer of warm air traps pollution close to the ground [2]. On calm winter nights, smoke from fireplaces, fire pits and fireworks then builds up, adding fine particles (PM2.5) [2].
Where does the dust come from?
Much of it is made by people: dust from construction sites, vacant lots and dirt roads, plus windblown dust [1]. In summer, thunderstorms add the big events: their downdrafts lift walls of dust called haboobs, and the Phoenix area gets one to three large dust storms a year [4].
What is being done about it?
Maricopa County declares No Burn Days when particle pollution is forecast to climb [1]. On those days all wood burning and most outdoor fires are banned, while gas and electric devices are still allowed [2].
Particle pollution has been getting worse, not better: the area's ranking for short-term particle spikes went from 28th to 17th worst between the Lung Association's 2025 and 2026 reports, and its year-round particle level still fails the federal standard [3].
How to protect yourself in Phoenix
From April to September, ozone builds through the hot afternoons. Exercise early in the morning and stay in during the afternoon on high-ozone days. Masks and filters don't stop ozone.
On winter No Burn Days and during dust storms, keep the windows shut and run a HEPA air purifier in the room you use most, sized for it. If you're caught driving in a dust storm, pull off the road as far as you can and stop.
Sources
- [1] Maricopa County Air Quality Department, Outreach
- [2] Maricopa County Air Quality Department, Maricopa County Air Quality Department Encourages Residents to "Burn Cleaner, Burn Better" This Holiday Season (November 2025)
- [3] American Lung Association, New Report: 1,376,206 Kids in Arizona are Breathing Unhealthy Levels of Air Pollution; Phoenix Among Most Polluted Cities in Country (April 2026)
- [4] PBS NewsHour (Associated Press), 3 things to know about haboobs, massive dust storms in the Southwest (August 2025)
Last reviewed . The figures in the box at the top update with every new reading; the guide itself is checked against its sources at least once a year, before the city's bad-air season.
Tree cover detail
Tree cover in Phoenix: Critically low
2.5% tree cover against a 30% healthy-neighborhood target, across 4.9 sq mi (12.57 km²).
Trees in this area
7,854
Target trees
94,248
More trees needed
86,394
CO₂ if planted / yr
1,901 t
Deforestation · 2001–2025
How much forest has Phoenix lost?
There was almost no forest around Phoenix in 2000, so there has been almost nothing to lose since. Only fairly dense woodland counts as forest in these maps, so scattered street and garden trees don't show up here.
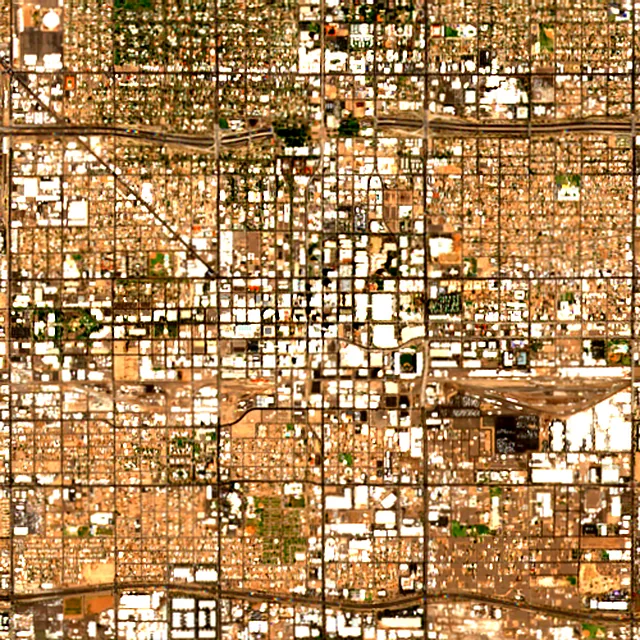
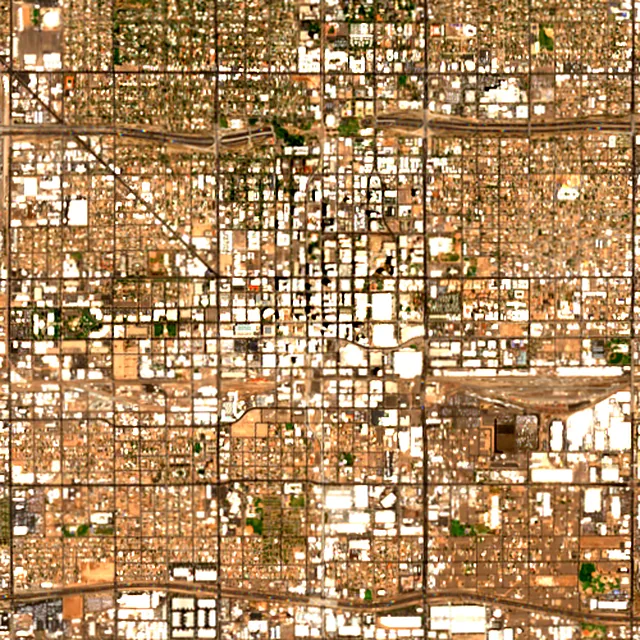

2017: satellite photo from June 2017 of a 5 × 5 km area in the city center.
These figures cover everything within 10 km of the city center, a wider area than the report above, because forest is usually lost at a city's edges.
Source: Hansen/UMD/Google/USGS/NASA, Global Forest Change (GFC-2025-v1.13); causes: WRI/Google DeepMind drivers of forest loss; both CC BY 4.0, summed by Airleaf for each area. Images: contains modified Copernicus Sentinel data. How it's measured
In the same region
Measured cities near Phoenix
Same 2 km radius, same index — so they compare directly.
- Glendale14.4 km
United States
- Tree cover
- 5%
- Air quality
- 67
- Tempe15.7 km
United States
- Tree cover
- 4%
- Air quality
- 26
- Scottsdale17.6 km
United States
- Tree cover
- 8%
- Air quality
- 36
- Mesa23.5 km
United States
- Tree cover
- 10%
- Air quality
- 36
- Chandler26.8 km
United States
- Tree cover
- 6%
- Air quality
- 23
- Deer Valley26.8 km
United States
- Tree cover
- 2%
- Air quality
- 53
Build your own
Compare Phoenix with anywhere
This place
Phoenix
Use this data
Put Phoenix's numbers on your site
Free to embed. Updates itself as the measurement refreshes.

Frequently asked
Questions about Phoenix
What is the air quality (AQI) in Phoenix right now?
The latest reading for Phoenix shows an AQI of 67 (Moderate), measured Nov 11, 07:00 local time by 6 ground monitoring stations via OpenAQ (the median of their readings; the nearest is Phoenix JLG Supersit, 4.0 mi (6.4 km) away). The main pollutant is PM2.5. Unusually sensitive people should consider limiting long outdoor exertion.
Is it safe to exercise outside in Phoenix today?
At AQI 67 (Moderate): fine for most people; unusually sensitive people should take long or hard exercise easier. Windows: fine to open; close them if you are sensitive to pollution. Masks: not needed for most people. The reading changes through the day, so check again before a long run or ride.
What has the air quality in Phoenix been like this week?
Over the last 7 days, the CAMS air-quality model put Phoenix's daily AQI at 55 on average, from 44 on Nov 7 to an hourly peak of 97 on Nov 4. No day averaged above 100, the level where the air turns unhealthy for sensitive groups.
Why is Phoenix's air quality so bad?
Mainly ozone: heat and sunshine turn exhaust gases into ozone from April through September, and Maricopa County averaged 58.2 unhealthy ozone days a year in 2022–2024. Dust and winter wood smoke add particle pollution.
When is ozone season in Phoenix?
April through September, by Maricopa County's definition. Ozone peaks on hot, sunny afternoons, so mornings are the better time to be outdoors.
What is a No Burn Day in Phoenix?
A day when Maricopa County expects particle pollution to climb. All wood burning and most outdoor fires are banned; gas and electric devices are still allowed.
How much forest has the area around Phoenix lost since 2001?
There was almost no forest around Phoenix in 2000, so there has been almost nothing to lose since. Only fairly dense woodland counts as forest in these maps, so scattered street and garden trees don't show up here.
What is the tree count in Phoenix?
Phoenix has an estimated 7,854 trees across the 4.9 sq mi (12.57 km²) measured — 2.5% tree cover, 27 percentage points short of the 30% tree-cover target set for this area.
How many more trees does Phoenix need?
Phoenix needs roughly 86,394 more trees to close a 27-point shortfall against its 30% tree-cover target — about 1,901 t of extra CO₂ absorbed per year once grown.
How are Phoenix's air quality and tree cover measured?
Air quality is measured by ground monitoring stations near Downtown Phoenix, via OpenAQ; the 7-day trend is the Open-Meteo / CAMS model's estimate. Tree cover is measured from Sentinel-2 L2A (ESA Copernicus) via Earth Search satellite imagery at 10 m detail across a 1.2 mi (2 km) radius around Downtown Phoenix; the tree count is an estimate derived from that cover.
See your own area
What does your neighborhood look like?
Pick any point and radius to get the same air-quality and tree-cover breakdown.
Check my address