City report · Delhi, India
New Delhi Air quality today
Air quality in New Delhi currently reads AQI 226 (Very unhealthy): Health alert — everyone should avoid long outdoor exertion.
Air quality right now
AQI 226
Very unhealthy
- PM2.5, fine particles (µg/m³)
- 151.0
- tree cover
- 56.6%
- trees in this area
- 178K
- more trees needed
- 0
Measured across a 2 km radius around Sansad Marg Area, New Delhi, Delhi 110001, India (12.57 km²), from a satellite image of Oct 10, 2026. Lower AQI is better: 0–50 is Good, above 300 is Hazardous.
New Delhi · AQI 226 (Very unhealthy)
New Delhi's tree count comes to 177,814 trees across 12.57 km², already at or above the 45% tree-cover level considered healthy for this area.
Air quality detail
Air quality in New Delhi today: AQI 226, Very unhealthy
Main pollutant: PM2.5 · Observed Nov 11, 20:00 local time via OpenAQ ground stations, US EPA index. Values in µg/m³.
Ground station · New Delhi, 1.9 km away · median of 18 stations
Health signal
Health alert — everyone should avoid long outdoor exertion.
PM2.5
151.0
PM10
266.0
NO₂
136.5
O₃
5.5
SO₂
45.6
CO
2.8
Data: OpenAQ · AirNow, CPCB, Central Pollution Control Board, Government of India (GODL-India)
- Outdoor exercise
- Everyone should avoid long or hard exercise outdoors; sensitive groups, all outdoor exertion
- Windows
- Keep them closed
- Mask
- Wear an N95 if you go out
- Air purifier
- Run one on high
Over the last 7 days, the CAMS air-quality model put New Delhi's daily AQI at 198 on average, from 173 on Nov 7 to an hourly peak of 267 on Nov 10.
This is the US EPA AQI. How it differs from India's AQI (CPCB) · The full guide
Where New Delhi stands: the most polluted cities in the world right now · the cleanest
City air guide
Why is Delhi's air so bad in autumn and winter?
Right now
- Today's AQI in New Delhi is 226, very unhealthy, mostly from PM2.5.
- Over the past 7 days, the daily average was 198.
- November is in New Delhi's usual season for smog (October to January), so expect bad days to come and go until it ends.
Delhi's air is at its worst from the last week of October to mid-November, when fine particle levels have reached about 500 µg/m³ in recent years [1]. Smoke from crop-stubble burning in Punjab and Haryana, carried in on northwest winds, arrives just as cold, still weather and inversion layers trap the city's own pollution from vehicles, industry and power stations, and Diwali fireworks add more [1].
Why is late October to mid-November the worst?
Several things land at once. Farmers in Punjab and Haryana burn rice stubble for about 15–20 days in that window, and the prevailing west and northwest winds carry the smoke towards Delhi [1]. At the same time, low temperatures, slow winds and inversion layers stop the city's own pollution from rising and dispersing [1].
In 2025, crop fires intensified in the last week of October, and air quality in Delhi and several other cities then got worse for about a month [2].
How much of it is crop burning?
It depends on the day. NASA scientist Pawan Gupta notes that studies put stubble burning's share anywhere from 10 to 50 percent; his own estimate is 40–70 percent on a peak day, 20–30 percent over a month or the burning season, and under 10 percent over a whole year [2].
The rest is made closer to home: vehicles, industry and power stations all year, and fireworks around Diwali, which often falls in the burning season [1].
Is crop burning going down?
Partly. Fire counts have fallen slightly with support from the Central Pollution Control Board and state governments, but stubble burning is still a significant contributor in October and November despite a ban [1].
Counting fires has also become harder. Fires that used to be lit around 1–2 p.m. now mostly burn between 4 and 6 p.m., after the main satellites have passed over, so many are missed [2].
How to protect yourself in New Delhi
From late October through the winter, keep windows shut on smoggy days and run a HEPA air purifier in the room you sleep in, sized for that room. On the worst days, run it on high and keep children and older family members indoors.
Outdoors, a well-fitted N95 mask cuts how much smog you breathe; cloth and surgical masks do little against fine particles. Avoid hard exercise outside when the AQI is very unhealthy, and check it before the school run.
Sources
- [1] Centre for Research on Energy and Clean Air (CREA), Trends of Delhi's air quality and stubble burning during the October-November period (Kumar and Dahiya) (October 2024)
- [2] NASA Earth Observatory, New Timing for Stubble Burning in India (December 2025)
Last reviewed . The figures in the box at the top update with every new reading; the guide itself is checked against its sources at least once a year, before the city's bad-air season.
Tree cover detail
Tree cover in New Delhi: Healthy tree cover
56.6% tree cover against a 45% healthy-neighborhood target, across 12.57 km².
Trees in this area
177,814
Target trees
177,814
More trees needed
0
CO₂ if planted / yr
0 kg
Deforestation · 2001–2025
How much forest has New Delhi lost?
Since 2001, the area within 10 km of New Delhi has lost about 2 hectares of forest: 1.1% of the forest it had in 2000. Most of it (71%) was deforestation, forest cleared for good, mainly for towns and roads.
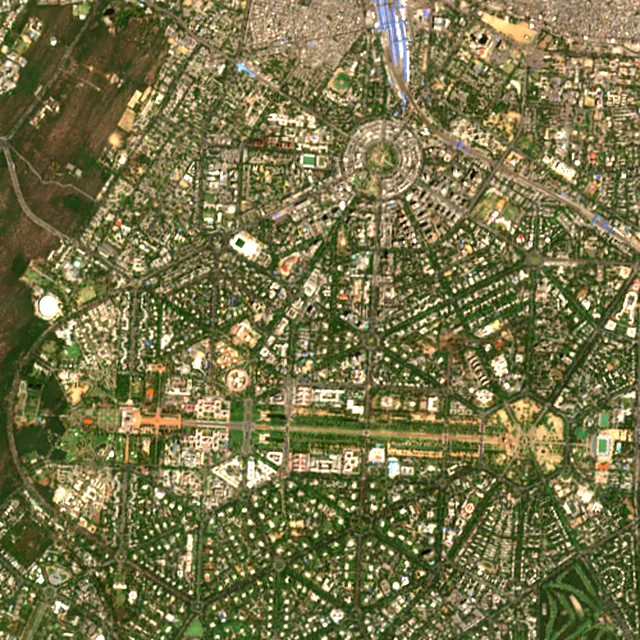
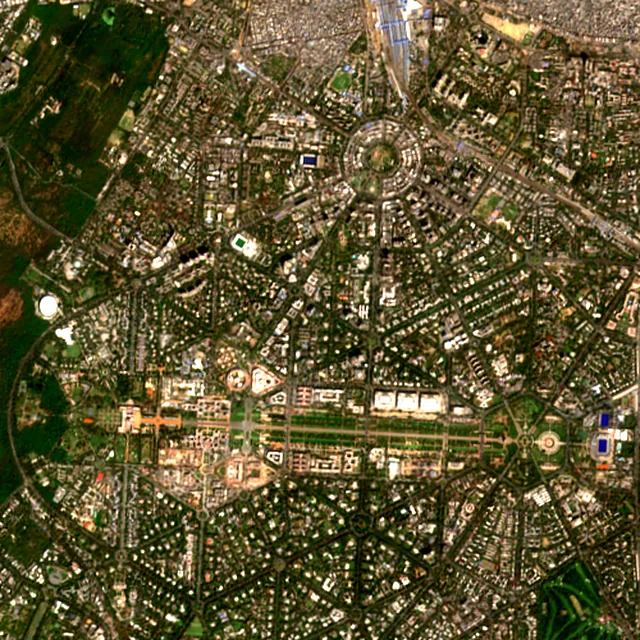

2017: satellite photo from April 2017 of a 5 × 5 km area in the city center.
- Forest lost since 2001
- 2 ha
- Share of its forest
- 1.1%of what there was in 2000
- Cleared for good
- 1 hadeforestation: turned into farms, mines or towns
Hectares of forest lost each year
Show the figures as a table
| Year | Cleared for good | Can grow back | Total |
|---|---|---|---|
| 2001 | under 1 ha | under 1 ha | under 1 ha |
| 2002 | under 1 ha | under 1 ha | under 1 ha |
| 2003 | under 1 ha | under 1 ha | under 1 ha |
| 2004 | under 1 ha | under 1 ha | under 1 ha |
| 2005 | under 1 ha | under 1 ha | under 1 ha |
| 2006 | under 1 ha | under 1 ha | under 1 ha |
| 2007 | under 1 ha | under 1 ha | under 1 ha |
| 2008 | under 1 ha | under 1 ha | under 1 ha |
| 2009 | under 1 ha | under 1 ha | under 1 ha |
| 2010 | under 1 ha | under 1 ha | under 1 ha |
| 2011 | under 1 ha | under 1 ha | under 1 ha |
| 2012 | under 1 ha | under 1 ha | under 1 ha |
| 2013 | under 1 ha | under 1 ha | under 1 ha |
| 2014 | under 1 ha | under 1 ha | under 1 ha |
| 2015 | under 1 ha | under 1 ha | under 1 ha |
| 2016 | under 1 ha | under 1 ha | under 1 ha |
| 2017 | under 1 ha | under 1 ha | under 1 ha |
| 2018 | under 1 ha | under 1 ha | under 1 ha |
| 2019 | under 1 ha | under 1 ha | under 1 ha |
| 2020 | under 1 ha | under 1 ha | under 1 ha |
| 2021 | under 1 ha | under 1 ha | under 1 ha |
| 2022 | under 1 ha | under 1 ha | under 1 ha |
| 2023 | under 1 ha | under 1 ha | under 1 ha |
| 2024 | under 1 ha | under 1 ha | under 1 ha |
| 2025 | under 1 ha | under 1 ha | under 1 ha |
What is causing deforestation around New Delhi?
- Towns and roadscleared for good65% · 1 ha
- Unknown causescause unknown35% · under 1 ha
Causes for 2025 are estimates, based on what caused forest loss in the same places up to 2024.
Forest gained and lost, 2000–2020
- Forest in 2000
- 467 ha
- Forest in 2020
- 670 ha
- Overall change
- +203 hamore forest than in 2000
Comparing satellite maps from 2000 and 2020, the forest around New Delhi grew from about 467 hectares to 670 hectares, a net gain of about 203 hectares (+43%). New forest grew on about 223 hectares, while 20 hectares were lost.
These 2000 and 2020 maps, from the University of Maryland, count any land with trees taller than 5 m as forest, including plantations and orchards. Forest that was cut or burned and had grown back by 2020 counts in both years, so the loss here is smaller than the yearly figures.
These figures cover everything within 10 km of the city center, a wider area than the report above, because forest is usually lost at a city's edges.
Source: Hansen/UMD/Google/USGS/NASA, Global Forest Change (GFC-2025-v1.13); causes: WRI/Google DeepMind drivers of forest loss; both CC BY 4.0, summed by Airleaf for each area. Forest gained and lost 2000–2020: Potapov et al. 2022, UMD GLAD Global Land Cover and Land Use Change, CC BY 4.0. Images: contains modified Copernicus Sentinel data. How it's measured
In the same region
Measured cities near New Delhi
Same 2 km radius, same index — so they compare directly.
- Noida12.2 km
India
- Tree cover
- 24%
- Air quality
- 189
- Deoli13.3 km
India
- Tree cover
- 37%
- Air quality
- 204
- Bhālswa Jahangirpur13.5 km
India
- Tree cover
- 13%
- Air quality
- 234
- Loni16.2 km
India
- Tree cover
- 7%
- Air quality
- 242
- Kirāri Sulemānnagar16.9 km
India
- Tree cover
- 11%
- Air quality
- 235
- Ghāziābād22.4 km
India
- Tree cover
- 18%
- Air quality
- 202
Also compared:New Delhi vs MumbaiNew Delhi vs BengaluruNew Delhi vs HyderabadNew Delhi vs Ahmedabad
Build your own
Compare New Delhi with anywhere
This place
New Delhi
Use this data
Put New Delhi's numbers on your site
Free to embed. Updates itself as the measurement refreshes.

Frequently asked
Questions about New Delhi
What is the air quality (AQI) in New Delhi right now?
The latest reading for New Delhi shows an AQI of 226 (Very unhealthy), measured Nov 11, 20:00 local time by 18 ground monitoring stations via OpenAQ (the median of their readings; the nearest is New Delhi, 1.9 km away). The main pollutant is PM2.5. Health alert — everyone should avoid long outdoor exertion.
Is it safe to exercise outside in New Delhi today?
At AQI 226 (Very unhealthy): everyone should avoid long or hard exercise outdoors; sensitive groups, all outdoor exertion. Windows: keep them closed. Masks: wear an N95 if you go out. The reading changes through the day, so check again before a long run or ride.
What has the air quality in New Delhi been like this week?
Over the last 7 days, the CAMS air-quality model put New Delhi's daily AQI at 198 on average, from 173 on Nov 7 to an hourly peak of 267 on Nov 10. On 7 of those days the average was above 100, unhealthy for sensitive groups.
Why is Delhi's air quality so bad in November?
Crop-stubble smoke from Punjab and Haryana arrives on northwest winds from late October, while cold, still weather and inversion layers trap Delhi's own pollution from vehicles, industry and power stations. Diwali fireworks add to it.
How much does stubble burning contribute to Delhi's pollution?
It varies by day. Studies range from 10 to 50 percent; a NASA scientist estimates 40–70 percent on a peak day, 20–30 percent over the burning season and under 10 percent across a year.
When is Delhi's air worst?
Usually from the last week of October to mid-November, when crop burning, Diwali and winter weather coincide, with smoggy days continuing through the cold months.
Is New Delhi's AQI the same as India's AQI (CPCB)?
No. Airleaf shows the US EPA Air Quality Index (AQI), the scale used by IQAir and most air-quality apps. India's Central Pollution Control Board (CPCB) publishes the National Air Quality Index on its own scale: 0–50 good, 51–100 satisfactory, 101–200 moderate, 201–300 poor, 301–400 very poor and 401–500 severe. The two scales don't line up. At moderate fine-particle levels the US scale reads higher: 55 µg/m³ of PM2.5 is 149 on the US AQI but about 92, "satisfactory", on India's. In heavy smog India's reads higher: 100 µg/m³ is 182 on the US AQI and about 232, "poor", on India's. CPCB also averages particles over 24 hours, so its figure moves more slowly than an hourly reading.
How much forest has the area around New Delhi lost since 2001?
Since 2001, the area within 10 km of New Delhi has lost about 2 hectares of forest: 1.1% of the forest it had in 2000. Most of it (71%) was deforestation, forest cleared for good, mainly for towns and roads. Comparing satellite maps from 2000 and 2020, the forest around New Delhi grew from about 467 hectares to 670 hectares, a net gain of about 203 hectares (+43%). New forest grew on about 223 hectares, while 20 hectares were lost.
What is the tree count in New Delhi?
New Delhi has an estimated 177,814 trees across the 12.57 km² measured — 56.6% tree cover, already past the 45% tree-cover target set for this area.
How many more trees does New Delhi need?
New Delhi has already reached its tree-cover target, so no additional trees are needed to close the gap.
How are New Delhi's air quality and tree cover measured?
Air quality is measured by ground monitoring stations near Sansad Marg Area, via OpenAQ; the 7-day trend is the Open-Meteo / CAMS model's estimate. Tree cover is measured from Sentinel-2 L2A (ESA Copernicus) via Earth Search satellite imagery at 10 m detail across a 2 km radius around Sansad Marg Area; the tree count is an estimate derived from that cover.
See your own area
What does your neighborhood look like?
Pick any point and radius to get the same air-quality and tree-cover breakdown.
Check my address