City report · Gunma, Japan
Maebashi Air quality today
Air quality in Maebashi currently reads AQI 33 (Good): Air quality is satisfactory for everyone.
AQI 33
Air quality right now
Good
- PM2.5, fine particles (µg/m³)
- 6.0
- tree cover
- 4.4%
- trees in this area
- 13.8K
- more trees needed
- 80.4K
Measured across a 2 km radius around 3 Chome Mitsumatamachi, Maebashi, Gunma 371-0018, Japan (12.57 km²), from a satellite image of Jul 22, 2026. Lower AQI is better: 0–50 is Good, above 300 is Hazardous.
Maebashi · AQI 33 (Good)
Maebashi's tree count comes to 13,823 trees across 12.57 km², 26 points below the 30% tree-cover level considered healthy for this area, so roughly 80,425 more trees would close the gap.
Air quality detail
Air quality in Maebashi today: AQI 33, Good
Main pollutant: PM2.5 · Observed Nov 12, 00:00 local time via World Air Quality Index Project ground stations, US EPA index. Values in µg/m³.
Ground station · Kodamachō Takazeki, Honjō-shi, Saitama-ken, Japan (本庄児玉本庄市), 21.4 km away
Health signal
Air quality is satisfactory for everyone.
PM2.5
6.0
PM10
9.7
NO₂
—
O₃
—
SO₂
—
CO
—
Data: World Air Quality Index Project, Saitama Prefecture EPA (埼玉県の大気状況), Japan Atmospheric Environmental Regional Observation System (環境省大気汚染物質広域監視システム)
- Outdoor exercise
- A good day to be active outside
- Windows
- Open them to air the house
- Mask
- Not needed
- Air purifier
- Not needed
Over the last 7 days, the CAMS air-quality model put Maebashi's daily AQI at 39 on average, from 18 on Nov 7 to an hourly peak of 88 on Nov 5.
Where Maebashi stands: the most polluted cities in the world right now · the cleanest
Tree cover detail
Tree cover in Maebashi: Critically low
4.4% tree cover against a 30% healthy-neighborhood target, across 12.57 km².
Trees in this area
13,823
Target trees
94,248
More trees needed
80,425
CO₂ if planted / yr
1,769 t
Deforestation · 2001–2025
How much forest has Maebashi lost?
Since 2001, the area within 10 km of Maebashi has lost about 143 hectares of forest (about 200 football pitches): 9.8% of the forest it had in 2000. Most of it was lost to logging, so much of it can grow back. About 30 hectares (21%) was deforestation: forest cleared for good for farms, mines or towns.
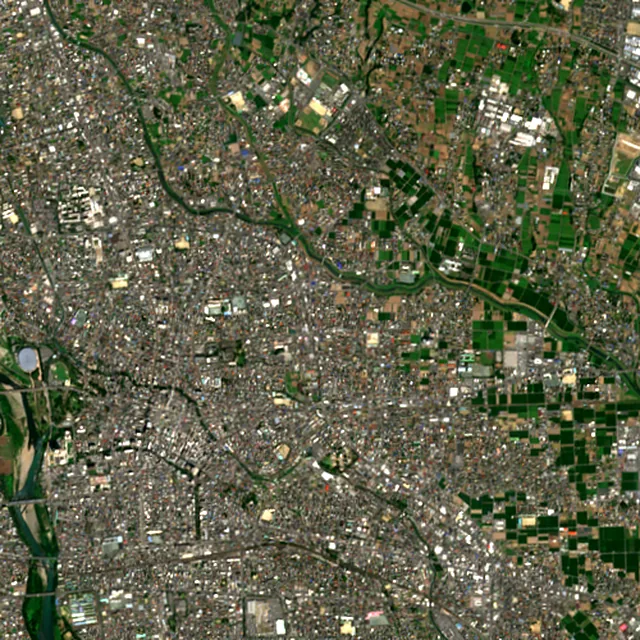
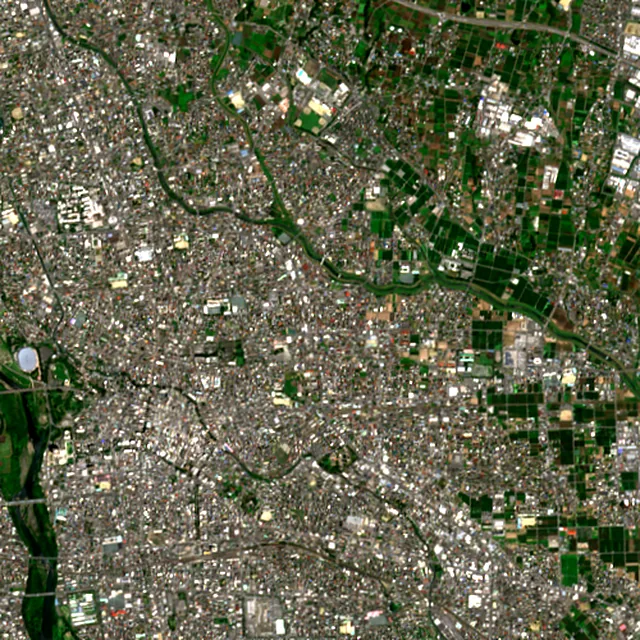

2017: satellite photo from September 2017 of a 5 × 5 km area in the city center.
- Forest lost since 2001
- 143 haabout 200 football pitches
- Share of its forest
- 9.8%of what there was in 2000
- Cleared for good
- 30 hadeforestation: turned into farms, mines or towns
The worst year was 2007, when about 18 hectares of forest were lost.
Hectares of forest lost each year
Show the figures as a table
| Year | Cleared for good | Can grow back | Total |
|---|---|---|---|
| 2001 | 1 ha | 12 ha | 13 ha |
| 2002 | 2 ha | 9 ha | 11 ha |
| 2003 | under 1 ha | 3 ha | 3 ha |
| 2004 | under 1 ha | 3 ha | 4 ha |
| 2005 | under 1 ha | 6 ha | 6 ha |
| 2006 | under 1 ha | under 1 ha | under 1 ha |
| 2007 | 4 ha | 14 ha | 18 ha |
| 2008 | 1 ha | 4 ha | 6 ha |
| 2009 | under 1 ha | 12 ha | 12 ha |
| 2010 | 3 ha | 13 ha | 16 ha |
| 2011 | under 1 ha | 13 ha | 14 ha |
| 2012 | under 1 ha | 4 ha | 4 ha |
| 2013 | under 1 ha | 3 ha | 3 ha |
| 2014 | under 1 ha | 2 ha | 2 ha |
| 2015 | under 1 ha | under 1 ha | 1 ha |
| 2016 | 2 ha | 2 ha | 4 ha |
| 2017 | 3 ha | 2 ha | 5 ha |
| 2018 | 6 ha | 2 ha | 8 ha |
| 2019 | 1 ha | 2 ha | 3 ha |
| 2020 | under 1 ha | under 1 ha | 1 ha |
| 2021 | under 1 ha | under 1 ha | under 1 ha |
| 2022 | under 1 ha | under 1 ha | 1 ha |
| 2023 | under 1 ha | 2 ha | 3 ha |
| 2024 | under 1 ha | 2 ha | 2 ha |
| 2025 | 2 ha | 1 ha | 3 ha |
What is causing deforestation around Maebashi?
- Loggingcan grow back73% · 105 ha
- Towns and roadscleared for good21% · 30 ha
- Unknown causescause unknown5.7% · 8 ha
Causes for 2025 are estimates, based on what caused forest loss in the same places up to 2024.
Forest gained and lost, 2000–2020
- Forest in 2000
- 2,270 ha
- Forest in 2020
- 2,260 ha
- Overall change
- −2 haless forest than in 2000
Comparing satellite maps from 2000 and 2020, the forest around Maebashi stayed about the same size, at about 2,260 hectares: new forest grew on about 83 hectares, and about 85 hectares were lost.
These 2000 and 2020 maps, from the University of Maryland, count any land with trees taller than 5 m as forest, including plantations and orchards. Forest that was cut or burned and had grown back by 2020 counts in both years, so the loss here is smaller than the yearly figures.
These figures cover everything within 10 km of the city center, a wider area than the report above, because forest is usually lost at a city's edges.
Source: Hansen/UMD/Google/USGS/NASA, Global Forest Change (GFC-2025-v1.13); causes: WRI/Google DeepMind drivers of forest loss; both CC BY 4.0, summed by Airleaf for each area. Forest gained and lost 2000–2020: Potapov et al. 2022, UMD GLAD Global Land Cover and Land Use Change, CC BY 4.0. Images: contains modified Copernicus Sentinel data. How it's measured
In the same region
Measured cities near Maebashi
Same 2 km radius, same index — so they compare directly.
Build your own
Compare Maebashi with anywhere
This place
Maebashi
Use this data
Put Maebashi's numbers on your site
Free to embed. Updates itself as the measurement refreshes.
Frequently asked
Questions about Maebashi
What is the air quality (AQI) in Maebashi right now?
The latest reading for Maebashi shows an AQI of 33 (Good), measured Nov 12, 00:00 local time by the Kodamachō Takazeki, Honjō-shi, Saitama-ken, Japan (本庄児玉本庄市) ground monitoring station, 21.4 km away, via OpenAQ. The main pollutant is PM2.5. Air quality is satisfactory for everyone.
Is it safe to exercise outside in Maebashi today?
At AQI 33 (Good): a good day to be active outside. Windows: open them to air the house. Masks: not needed. The reading changes through the day, so check again before a long run or ride.
What has the air quality in Maebashi been like this week?
Over the last 7 days, the CAMS air-quality model put Maebashi's daily AQI at 39 on average, from 18 on Nov 7 to an hourly peak of 88 on Nov 5. No day averaged above 100, the level where the air turns unhealthy for sensitive groups.
How much forest has the area around Maebashi lost since 2001?
Since 2001, the area within 10 km of Maebashi has lost about 143 hectares of forest (about 200 football pitches): 9.8% of the forest it had in 2000. Most of it was lost to logging, so much of it can grow back. About 30 hectares (21%) was deforestation: forest cleared for good for farms, mines or towns. Comparing satellite maps from 2000 and 2020, the forest around Maebashi stayed about the same size, at about 2,260 hectares: new forest grew on about 83 hectares, and about 85 hectares were lost.
What is the tree count in Maebashi?
Maebashi has an estimated 13,823 trees across the 12.57 km² measured — 4.4% tree cover, 26 percentage points short of the 30% tree-cover target set for this area.
How many more trees does Maebashi need?
Maebashi needs roughly 80,425 more trees to close a 26-point shortfall against its 30% tree-cover target — about 1,769 t of extra CO₂ absorbed per year once grown.
How are Maebashi's air quality and tree cover measured?
Air quality is measured by ground monitoring stations near 3 Chome Mitsumatamachi, via OpenAQ; the 7-day trend is the Open-Meteo / CAMS model's estimate. Tree cover is measured from Sentinel-2 L2A (ESA Copernicus) via Earth Search satellite imagery at 10 m detail across a 2 km radius around 3 Chome Mitsumatamachi; the tree count is an estimate derived from that cover.
See your own area
What does your neighborhood look like?
Pick any point and radius to get the same air-quality and tree-cover breakdown.
Check my address