City report · Singapore
Singapore Air quality today
Air quality in Singapore currently reads AQI 62 (Moderate): Unusually sensitive people should consider limiting long outdoor exertion.
AQI 62
Air quality right now
Moderate
- PM2.5, fine particles (µg/m³)
- 15.0
- tree cover
- 19.4%
- trees in this area
- 54.4K
- more trees needed
- 29.7K
Measured across a 2 km radius around Downtown Core, Singapore (12.57 km²), from a satellite image of Sep 3, 2026. Lower AQI is better: 0–50 is Good, above 300 is Hazardous.
Singapore · AQI 62 (Moderate)
Singapore's tree count comes to 54,426 trees across 11.23 km² of land, 11 points below the 30% tree-cover level considered healthy for this area, so roughly 29,738 more trees would close the gap.
Air quality detail
Air quality in Singapore today: AQI 62, Moderate
Main pollutant: PM2.5 · Observed Nov 11, 23:00 local time via World Air Quality Index Project ground stations, US EPA index. Values in µg/m³.
Ground station · South, Singapore, 800 m away
Health signal
Unusually sensitive people should consider limiting long outdoor exertion.
PM2.5
15.0
PM10
28.1
NO₂
—
O₃
—
SO₂
—
CO
—
Data: World Air Quality Index Project, NEA - Singapore National Environment Agency
- Outdoor exercise
- Fine for most people; unusually sensitive people should take long or hard exercise easier
- Windows
- Fine to open; close them if you are sensitive to pollution
- Mask
- Not needed for most people
- Air purifier
- Worth running if you are sensitive
Over the last 7 days, the CAMS air-quality model put Singapore's daily AQI at 59 on average, from 52 on Nov 8 to an hourly peak of 82 on Nov 11.
This is the US EPA AQI. How it differs from Singapore's PSI · The full guide
Where Singapore stands: the most polluted cities in the world right now · the cleanest
City air guide
Why does Singapore get haze, and when is it worst?
Right now
- Today's AQI in Singapore is 62, moderate, mostly from PM2.5.
- Over the past 7 days, the daily average was 59.
- Singapore's air is usually worst for Southwest Monsoon haze from June to September.
Singapore gets smoke haze from time to time, from forest fires in the region that start when land is burned to clear it for farming [1]. During haze, fine particles called PM2.5 are the main pollutant [3]. Winds sometimes carry the smoke over Singapore, especially in the Southwest Monsoon season, which runs from June to September [1] [2]. In June 2013, smoke from fires on the Indonesian island of Sumatra pushed Singapore's pollution index to the highest level recorded up to then [4].
What is the haze, and where does it come from?
The haze is smoke from regional forest fires, which start when open burning is used to clear land for farming [1]. NEA, Singapore's National Environment Agency, says the haze that reaches Singapore mainly comes from forest and peat fires in the region [3]. Besides smoke particles, these fires give off a mix of gases that cause an acrid burning smell [3].
Haze is often worse in dry periods, when rain is low, and when the wind changes direction [1]. In June 2013, NASA satellites saw smoke from illegal fires on Sumatra blowing east toward southern Malaysia and Singapore [4]. NASA noted that farmers in Sumatra often burn forests in the dry season to prepare soil for new crops, though local laws ban it [4].
When is haze season in Singapore?
Singapore has two monsoon seasons. The Northeast Monsoon runs from December to early March, and the Southwest Monsoon from June to September [2]. In the Southwest Monsoon, winds generally blow from the southeast or south [2].
The Meteorological Service Singapore says slight to moderate haze is common during the Southwest Monsoon [2]. NEA says prevailing winds sometimes carry smoke from the forest fires over Singapore, particularly during the Southwest Monsoon [1].
In July 2026, with El Nino conditions building, a climate and health research centre at Nanyang Technological University said haze episodes were more likely between July and October that year [8]. It named August and September as the greatest concern, and linked the risk to southwest monsoon winds that can carry smoke toward Singapore [8].
What are the PSI and PM2.5, and is the PSI the same as the AQI?
PM2.5 is fine particulate matter, meaning very small particles in the air [3]. It is the main pollutant when transboundary haze, haze blown in from other countries, reaches Singapore [3]. The PSI, or Pollutant Standards Index, is Singapore's main measure of air pollution [4]. NEA works it out from 24-hour averages of six pollutants, and the highest of their sub-scores becomes the PSI [3]. PM2.5 was added as the sixth pollutant in April 2014 [3].
NEA's PSI bands are 0 to 50 Good, 51 to 100 Moderate, 101 to 200 Unhealthy, 201 to 300 Very Unhealthy, and above 300 Hazardous [3]. NEA also publishes 1-hour PM2.5 readings, a key sign of the air at that moment [3]. Outside haze periods, NEA's records show 1-hour PM2.5 stays below 55 micrograms per cubic metre about 99 per cent of the time [3].
NASA describes the PSI as similar to the Air Quality Index, or AQI, used by the US Environmental Protection Agency [4]. NEA says Singapore referred to the US system, but the two are not identical, and indices from other websites are not comparable with the 24-hour PSI [3].
What were Singapore's worst haze episodes?
In June 2013, the PSI rose to 371 on June 20, which NASA reported as the highest level ever recorded at the time [4]. The earlier record was 226, set in 1997 [4].
NEA's records show haze episodes in September 2015 and September 2019, when transboundary haze affected Singapore [3]. Between 9 and 23 September 2019, smoke from land and vegetation fires in Sumatra brought hazy conditions [5]. The 24-hour PSI peaked at 154, in the Unhealthy range, in southern Singapore on 19 September 2019 [5]. Showers in the last week of that month helped ease the haze [5].
What is Singapore doing about the haze?
In August 2014, Singapore's Parliament passed the Transboundary Haze Pollution Act 2014 [7]. It lets regulators prosecute companies and individuals that cause severe air pollution in Singapore by burning forests and peatlands in neighbouring countries [7]. The law was first proposed after fires in Indonesia spiked in June 2013 [7].
NEA leads a Haze Task Force of 28 government agencies, which makes and carries out plans to manage the impact of haze [3]. NEA and the Meteorological Service Singapore also host the ASEAN Specialised Meteorological Centre, which monitors forest fires and smoke haze in the ASEAN region of Southeast Asia [1].
How to protect yourself in Singapore
NEA says reducing outdoor activity and physical effort can help limit the ill effects of haze [1]. Use the 24-hour PSI forecast to plan ahead, and the 1-hour PM2.5 reading for things you are about to do, like going for a jog [6].
When the PSI is in the Unhealthy range, the official health advisory says healthy people should reduce prolonged or strenuous outdoor exertion [3]. Older people, pregnant women and children should minimise it, and people with chronic lung or heart disease should avoid it [3]. At Hazardous levels, healthy people should minimise outdoor activity, and the other groups should avoid it [3].
Anyone who does not feel well, especially older people, children and people with chronic heart or lung conditions, should seek medical attention [1] [6].
Sources
- [1] National Environment Agency, Singapore, Who We Are (September 2024)
- [2] Meteorological Service Singapore, Climate of Singapore
- [3] National Environment Agency, Singapore, FAQs (October 2026)
- [4] NASA Earth Observatory, Smoke Engulfs Singapore (June 2013)
- [5] National Environment Agency, Singapore, New temperature and rainfall records for September 2019 (October 2019)
- [6] National Environment Agency, Singapore, Haze Situation Update (17 September 2019) (September 2019)
- [7] World Resources Institute, STATEMENT: Singapore's New Haze Pollution Law A New Way of Doing Business (August 2014)
- [8] Centre for Climate Change and Environmental Health, NTU Singapore, El Nino Raises Cross-Border Haze Risk Across Southeast Asia: Singapore Urged for Preparedness (July 2026)
Last reviewed . The figures in the box at the top update with every new reading; the guide itself is checked against its sources at least once a year, before the city's bad-air season.
Tree cover detail
Tree cover in Singapore: Below target
19.4% tree cover against a 30% healthy-neighborhood target, across 11.23 km² of land.
Trees in this area
54,426
Target trees
84,164
More trees needed
29,738
CO₂ if planted / yr
654.2 t
Deforestation · 2001–2025
How much forest has Singapore lost?
Since 2001, the area within 10 km of Singapore has lost about 468 hectares of forest (about 660 football pitches): 12% of the forest it had in 2000. Most of it (98%) was deforestation, forest cleared for good, mainly for towns and roads.
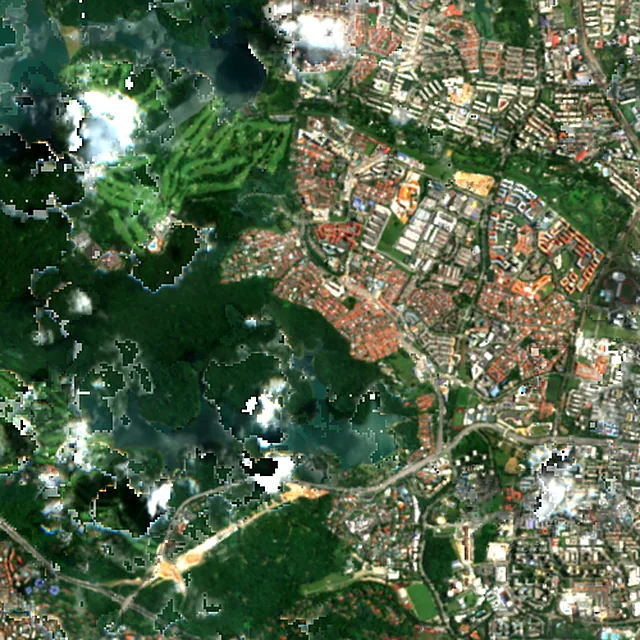
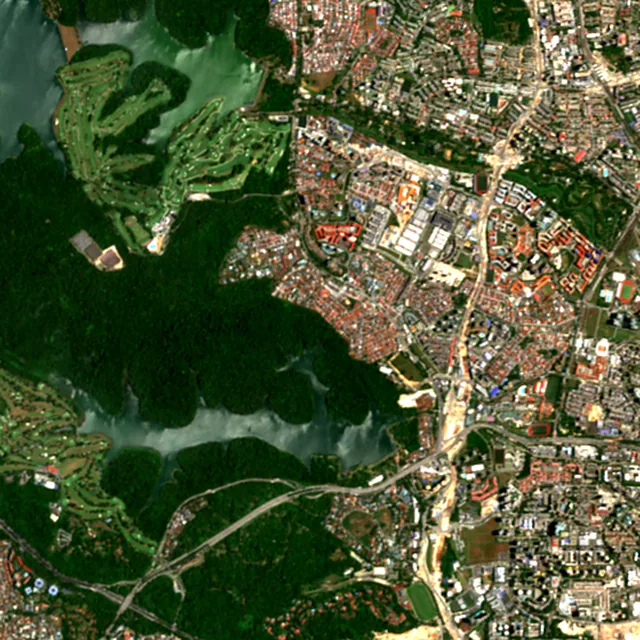

2017: satellite photo from April 2017 of a 5 × 5 km area about 7 km north of the city center.
- Forest lost since 2001
- 468 haabout 660 football pitches
- Share of its forest
- 12%of what there was in 2000
- Cleared for good
- 461 hadeforestation: turned into farms, mines or towns
The worst year was 2009, when about 50 hectares of forest were lost.
Singapore's full deforestation reportHectares of forest lost each year
Show the figures as a table
| Year | Cleared for good | Can grow back | Total |
|---|---|---|---|
| 2001 | 2 ha | under 1 ha | 2 ha |
| 2002 | 11 ha | under 1 ha | 11 ha |
| 2003 | under 1 ha | under 1 ha | under 1 ha |
| 2004 | 4 ha | under 1 ha | 5 ha |
| 2005 | 34 ha | under 1 ha | 35 ha |
| 2006 | 16 ha | under 1 ha | 16 ha |
| 2007 | 19 ha | under 1 ha | 20 ha |
| 2008 | 26 ha | under 1 ha | 27 ha |
| 2009 | 49 ha | under 1 ha | 50 ha |
| 2010 | 9 ha | under 1 ha | 10 ha |
| 2011 | 24 ha | under 1 ha | 24 ha |
| 2012 | 23 ha | 1 ha | 24 ha |
| 2013 | 2 ha | under 1 ha | 2 ha |
| 2014 | 18 ha | under 1 ha | 18 ha |
| 2015 | 20 ha | under 1 ha | 20 ha |
| 2016 | 19 ha | under 1 ha | 20 ha |
| 2017 | 36 ha | under 1 ha | 36 ha |
| 2018 | 23 ha | under 1 ha | 23 ha |
| 2019 | 30 ha | under 1 ha | 30 ha |
| 2020 | 14 ha | under 1 ha | 14 ha |
| 2021 | 9 ha | under 1 ha | 9 ha |
| 2022 | 12 ha | under 1 ha | 12 ha |
| 2023 | 35 ha | under 1 ha | 36 ha |
| 2024 | 11 ha | under 1 ha | 11 ha |
| 2025 | 14 ha | under 1 ha | 14 ha |
What is causing deforestation around Singapore?
- Towns and roadscleared for good74% · 345 ha
- Farms, pasture and plantationscleared for good25% · 116 ha
- Unknown causescause unknown1.6% · 7 ha
Causes for 2025 are estimates, based on what caused forest loss in the same places up to 2024.
Forest gained and lost, 2000–2020
- Forest in 2000
- 5,520 ha
- Forest in 2020
- 5,190 ha
- Overall change
- −331 haless forest than in 2000
Comparing satellite maps from 2000 and 2020, the forest around Singapore shrank from about 5,520 hectares to 5,190 hectares, a net loss of about 331 hectares (−6%). New forest grew on about 234 hectares, but 566 hectares were lost.
These 2000 and 2020 maps, from the University of Maryland, count any land with trees taller than 5 m as forest, including plantations and orchards. Forest that was cut or burned and had grown back by 2020 counts in both years, so the loss here is smaller than the yearly figures.
These figures cover everything within 10 km of the city center, a wider area than the report above, because forest is usually lost at a city's edges.
Source: Hansen/UMD/Google/USGS/NASA, Global Forest Change (GFC-2025-v1.13); causes: WRI/Google DeepMind drivers of forest loss; both CC BY 4.0, summed by Airleaf for each area. Forest gained and lost 2000–2020: Potapov et al. 2022, UMD GLAD Global Land Cover and Land Use Change, CC BY 4.0. Images: contains modified Copernicus Sentinel data. How it's measured
In the same region
Measured cities near Singapore
Same 2 km radius, same index — so they compare directly.
- Punggol15.2 km
Singapore
- Tree cover
- 19%
- Air quality
- 72
- Woodlands17.8 km
Singapore
- Tree cover
- 28%
- Air quality
- 75
- Pasir Gudang20.1 km
Malaysia
- Tree cover
- 24%
- Air quality
- 81
- Johor Bahru22.1 km
Malaysia
- Tree cover
- 22%
- Air quality
- 76
- Batam24.9 km
Indonesia
- Tree cover
- 16%
- Air quality
- 116
Build your own
Compare Singapore with anywhere
This place
Singapore
Use this data
Put Singapore's numbers on your site
Free to embed. Updates itself as the measurement refreshes.
Frequently asked
Questions about Singapore
What is the air quality (AQI) in Singapore right now?
The latest reading for Singapore shows an AQI of 62 (Moderate), measured Nov 11, 23:00 local time by the South, Singapore ground monitoring station, 800 m away, via OpenAQ. The main pollutant is PM2.5. Unusually sensitive people should consider limiting long outdoor exertion.
Is it safe to exercise outside in Singapore today?
At AQI 62 (Moderate): fine for most people; unusually sensitive people should take long or hard exercise easier. Windows: fine to open; close them if you are sensitive to pollution. Masks: not needed for most people. The reading changes through the day, so check again before a long run or ride.
What has the air quality in Singapore been like this week?
Over the last 7 days, the CAMS air-quality model put Singapore's daily AQI at 59 on average, from 52 on Nov 8 to an hourly peak of 82 on Nov 11. No day averaged above 100, the level where the air turns unhealthy for sensitive groups.
When is haze season in Singapore?
Haze is common in the Southwest Monsoon season, which runs from June to September, when winds can carry smoke from regional fires over Singapore. In July 2026, a research centre at Nanyang Technological University said haze episodes were more likely from July to October that year.
What causes the haze in Singapore?
Smoke from forest and land fires in the region, which start when land is burned to clear it for farming. In the 2013 and 2019 haze episodes, the smoke came from fires on the Indonesian island of Sumatra.
Is Singapore's PSI the same as the AQI?
No. Singapore's Pollutant Standards Index drew on the US Air Quality Index but is not identical, and NEA says indices from other websites are not comparable with its 24-hour PSI.
What PSI level is unhealthy in Singapore?
A 24-hour PSI of 101 to 200 is Unhealthy, 201 to 300 is Very Unhealthy, and above 300 is Hazardous. Readings of 100 or below are Good or Moderate.
Does poor visibility mean the air is more polluted?
Not always. NEA says poor visibility does not mean the air is more polluted, because water vapour in the air also lowers visibility. The official PSI and PM2.5 readings are a better guide.
What was the worst haze in Singapore?
In June 2013, smoke from fires in Sumatra pushed the PSI to 371 on June 20, which NASA reported as the highest level ever recorded at the time. The earlier record, 226, was set in 1997.
Is Singapore's AQI the same as Singapore's PSI?
No. Airleaf shows the US EPA Air Quality Index (AQI), the scale used by IQAir and most air-quality apps. Singapore's National Environment Agency (NEA) reports the 24-hour Pollutant Standards Index (PSI) for five regions of the island: north, south, east, west and central. Both scales call 0–50 good and 51–100 moderate; above that the PSI runs 101–200 unhealthy, 201–300 very unhealthy and over 300 hazardous. Because the PSI averages 24 hours, it moves more slowly than an hourly reading, and NEA suggests its 1-hour PM2.5 reading for plans right now. The official figures are on haze.gov.sg.
How much forest has the area around Singapore lost since 2001?
Since 2001, the area within 10 km of Singapore has lost about 468 hectares of forest (about 660 football pitches): 12% of the forest it had in 2000. Most of it (98%) was deforestation, forest cleared for good, mainly for towns and roads. Comparing satellite maps from 2000 and 2020, the forest around Singapore shrank from about 5,520 hectares to 5,190 hectares, a net loss of about 331 hectares (−6%). New forest grew on about 234 hectares, but 566 hectares were lost.
What is the tree count in Singapore?
Singapore has an estimated 54,426 trees across the 11.23 km² of land measured — 19.4% tree cover, 11 percentage points short of the 30% tree-cover target set for this area.
How many more trees does Singapore need?
Singapore needs roughly 29,738 more trees to close a 11-point shortfall against its 30% tree-cover target — about 654.2 t of extra CO₂ absorbed per year once grown.
How are Singapore's air quality and tree cover measured?
Air quality is measured by ground monitoring stations near Downtown Core, via OpenAQ; the 7-day trend is the Open-Meteo / CAMS model's estimate. Tree cover is measured from Sentinel-2 L2A (ESA Copernicus) via Earth Search satellite imagery at 10 m detail across a 2 km radius around Downtown Core; the tree count is an estimate derived from that cover.
See your own area
What does your neighborhood look like?
Pick any point and radius to get the same air-quality and tree-cover breakdown.
Check my address