Kumasi vs Obuase
Tree cover and air quality for both, measured the same way: Sentinel-2 imagery at 10 m detail over a 2 km radius from each city centre, and the live US EPA air quality index. Same radius and same index, so the two numbers compare directly.
Obuase has more tree cover — 41.1% against 23.8%.
Obuase has cleaner air right now — AQI 37 against 153.
- Tree cover gap
- 17.3 points
- Obuase is ahead.
- Air quality gap
- 116 AQI
- Obuase is cleaner.
- Trees between them
- 54.3K
- Obuase has more standing.
Tree cover
Share of the 2 km radius under canopy.
23.8%
41.1%
Air quality index
US EPA index, live, with its band. Lower is better.
153 · Unhealthy
37 · Good
Trees standing
Estimated from the measured canopy area.
74.8K
129K
Trees still needed
To reach the same canopy target. Fewer is better.
50.9K
0
CO₂ absorbed each year
By the trees already standing.
1.6M kg
2.8M kg
Seen from above
Tree cover on the satellite image
The same 2 km radius around each centre, with the tree cover the satellite found marked on it.
Satellite timelapses
Watch both change, year by year
A clear satellite photo a year of the land around each city. Press play, turn on the forest cleared since the first year, or drag the before and after.
Kumasi
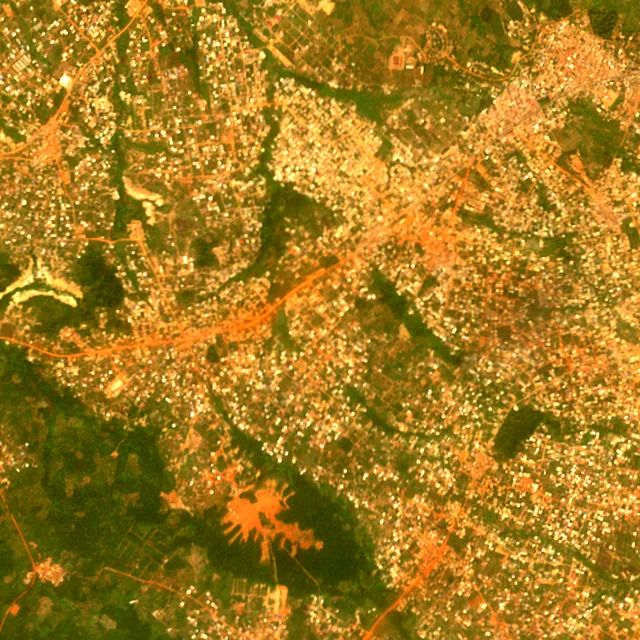
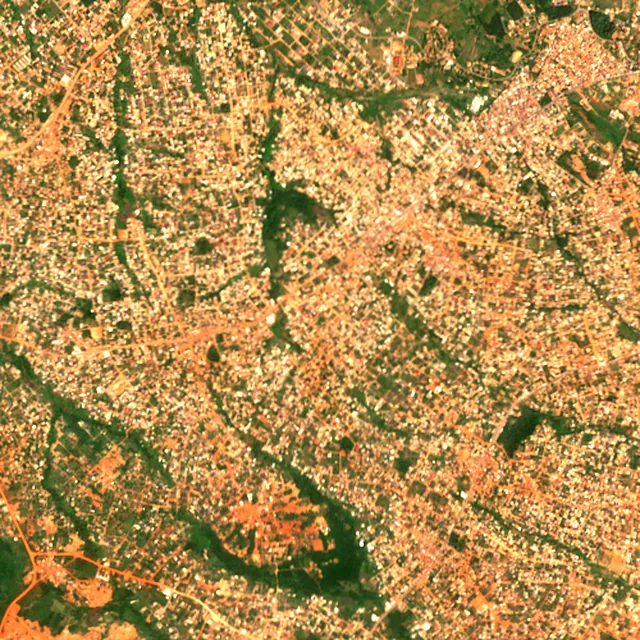
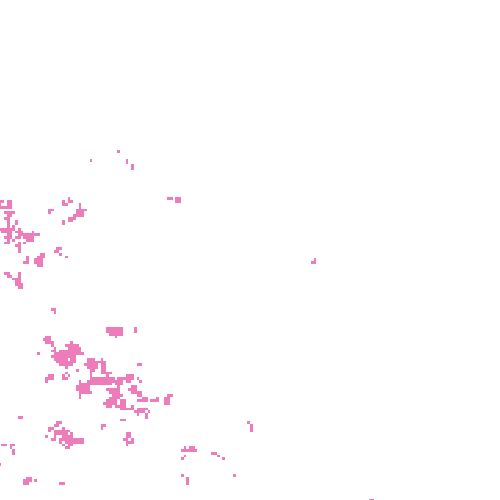
2017: satellite photo from January 2017 of a 5 × 5 km area about 7 km south-west of the city centre.
Obuase
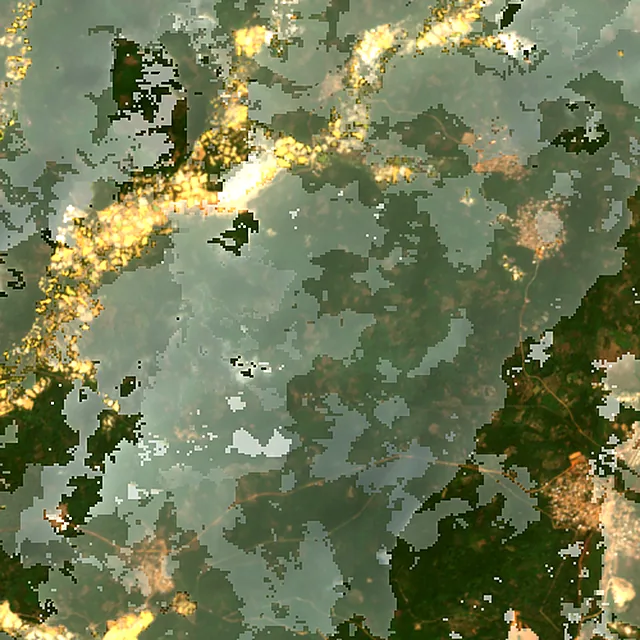
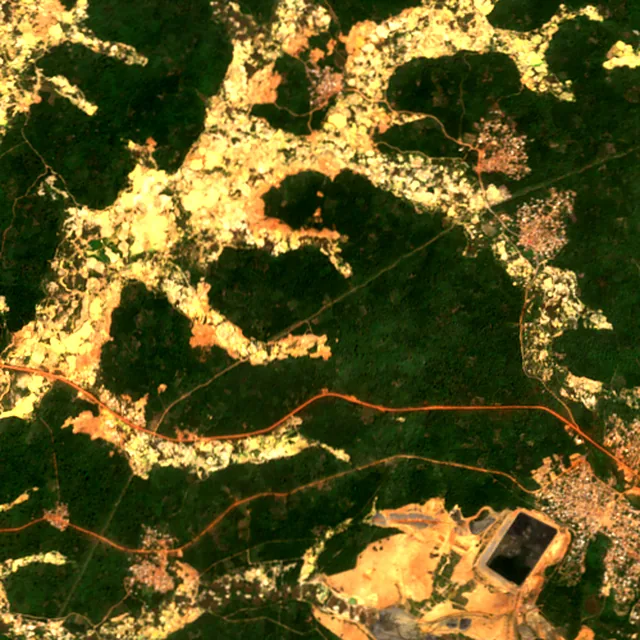

2017: satellite photo from January 2017 of a 5 × 5 km area about 7 km west of the city centre.
Deforestation · 2001–2025
How much forest each has lost
Within 10 km of each city centre, from the yearly satellite maps of forest loss: a wider circle than the tree cover above, because forest is usually lost at a city's edges. Less is better in every row.
Kumasi
Obuase
Forest lost since 2001
Cleared, burned or logged.
1,170 ha
8,610 ha
Share of its forest
Of the forest it had in 2000.
49%
34%
Cleared for good
Deforestation: turned into farms, mines or towns.
1,170 ha
8,610 ha
Air quality in detail
What each city is breathing
Concentrations in µg/m³, measured at the same moment as the index above. Lower is better in every row. Kumasi is read from nearby ground stations and Obuase is modelled — worth knowing, since the two are not quite like for like.
PM2.5
Fine particles, the pollutant that usually sets the index.
57.7 µg/m³
8 µg/m³
The last week, day by day
A single reading can catch a city on a bad afternoon. The week says whether it was the weather or the place.
| Day | Kumasi | Obuase |
|---|---|---|
| 13 Oct | 58 | 51 |
| 14 Oct | 46 | 43 |
| 15 Oct | 42 | 37 |
| 16 Oct | 58 | 53 |
| 17 Oct | 55 | 48 |
| 18 Oct | 50 | 41 |
Reading these numbers
What is actually being measured
Tree cover
The share of ground under canopy inside a 2 km radius of each city centre, read from Sentinel-2 satellite imagery at 10 m detail. It is a measurement of that circle, not of the whole municipality — which is exactly what makes the two comparable, since city boundaries are drawn to wildly different rules around the world. Obuase leads here at 41.1%.
Air quality index
The live US EPA index, computed from current pollutant concentrations — ground stations where a city has them nearby, and a model everywhere else. It moves hour to hour, so this is a snapshot rather than a verdict on either place: Kumasi reads 153 (unhealthy) and Obuase reads 37 (good) right now.
Frequently asked
Kumasi and Obuase, answered
Which has more trees, Kumasi or Obuase?
Obuase, with roughly 129,119 trees inside its 2 km radius against 74,770. Tree cover tells a slightly different story from raw count: Obuase has the denser canopy at 41.1%.
Which has better air quality, Kumasi or Obuase?
Obuase right now, at AQI 37 against 153 — a gap of 116 points. This is a live reading rather than an annual average, so it can reverse within a day.
How many more trees does each city need?
Kumasi needs about 50,894 more to reach its canopy target, and Obuase about 0. The target is the same share of ground for both, so the figures are directly comparable.
Which has lost more forest, Kumasi or Obuase?
Obuase, which lost about 8,610 ha of forest within 10 km of its centre from 2001 to 2025, against 1,170 ha around Kumasi. Of that, 8,610 ha around Obuase was cleared for good, for farms, mines or towns.
Are these two measured the same way?
Yes — that is the point of the page. Identical radius, identical satellite source at 10 m detail, and the same US EPA index for air. Nothing here is adjusted for population, city limits or climate, so the numbers describe the same-sized circle of ground in each place.
Keep going
Other comparisons nearby
Build your own
Compare Kumasi with somewhere else
This place
Kumasi
Want a different pair? Browse comparisons or measure any address.