Air quality · 6 min read
Malaysia's API (IPU) vs AQI: why the numbers differ
Check the air in Malaysia on a hazy day and you will usually find two different numbers. The Department of Environment reports the Air Pollutant Index: the API, or Indeks Pencemar Udara (IPU) in Malay. Most apps, IQAir and Airleaf included, show the US Air Quality Index instead. Both turn red when the air is bad, but they are not the same number, and reading one against the other's bands leads to the wrong decision.
By Airleaf research team ·
What the API (IPU) is
The API is Malaysia's official measure of air quality. The Department of Environment (Jabatan Alam Sekitar) publishes it every hour for each of its monitoring stations on APIMS, the Air Pollutant Index of Malaysia System, at apims.doe.gov.my.
Each station measures six pollutants: fine particles (PM2.5), coarser particles (PM10), ozone, carbon monoxide, nitrogen dioxide and sulphur dioxide. Each is turned into a sub-index, and the API is the highest of the six. Fine particles were added to the calculation in August 2018, and since then PM2.5 sets the reading on most days, and on nearly every haze day.
The API bands
The Department of Environment reads its index in five bands:
- 0–50: Good (Baik)
- 51–100: Moderate (Sederhana)
- 101–200: Unhealthy (Tidak Sihat)
- 201–300: Very unhealthy (Sangat Tidak Sihat)
- Above 300: Hazardous (Berbahaya)
Why your app shows a different number
The US AQI, set by the US Environmental Protection Agency, also starts at 0–50 good and 51–100 moderate, but above 100 it splits the range more finely: 101–150 is unhealthy for sensitive groups, 151–200 unhealthy, 201–300 very unhealthy and above 300 hazardous. Its fine-particle table was tightened in 2024, so only air with 9 µg/m³ of PM2.5 or less now counts as good.
Malaysia's index was modelled on the older US Pollutant Standards Index rather than today's AQI, and the two use different breakpoints and averaging periods. The Department of Environment doesn't publish its full PM2.5 table, so there is no exact conversion between them, and for the same town and hour the two numbers will often differ.
Neither is wrong: they are different rulers. The rule that works is to compare like with like. Read the API against the API's bands, and the AQI against the AQI's.
Why the haze keeps coming back
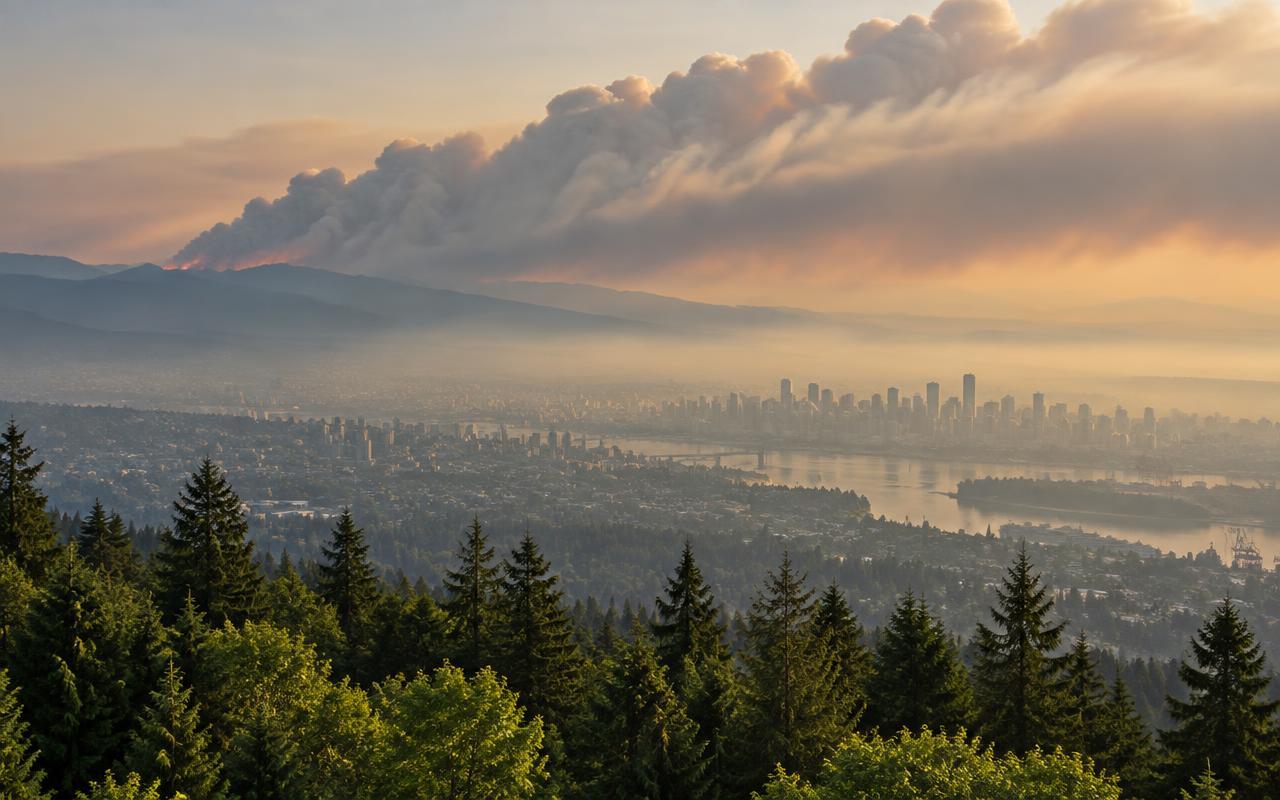
Most of Malaysia's worst air days come from transboundary haze: smoke from forest and peatland fires in Sumatra and Kalimantan, carried across by the southwest monsoon winds, typically between June and October. Dry El Niño years make it worse.
Peat is the heart of it. Drained peatland, much of it cleared for plantations, can smoulder underground for weeks, and burning peat gives off far more smoke than a forest fire. That is the link between the haze and deforestation: the land that burns longest is land that has already been cleared and drained. Airleaf's deforestation pages show how much forest Malaysia and Indonesia have lost since 2001, and what cleared it.
What to do at each level
Whichever index you check, act on the band, not the digits:
- Moderate: fine for most people; if you have asthma or a heart or lung condition, take it easier on long outdoor exercise
- Unhealthy: cut down long or hard outdoor activity, keep windows closed, and run an air purifier with a HEPA filter if you have one
- Very unhealthy: stay indoors as much as you can, and wear a well-fitted N95 or equivalent mask if you have to go out; cloth and surgical masks don't stop fine particles
- Hazardous: avoid going outside, and follow the instructions of the Department of Environment and your state government
How to check both
For the official API, open APIMS and pick the station nearest you. For a reading tied to your own town, the pollutants behind it and the past week of readings, Airleaf's Malaysia reports show the US AQI for more than 50 cities and towns, from Kuala Lumpur and Johor Bahru to Kuala Kubu Bharu, each with a note on how it differs from the IPU.
Put it into practice
See how many trees your own street has and how clean its air is.
Check my area →