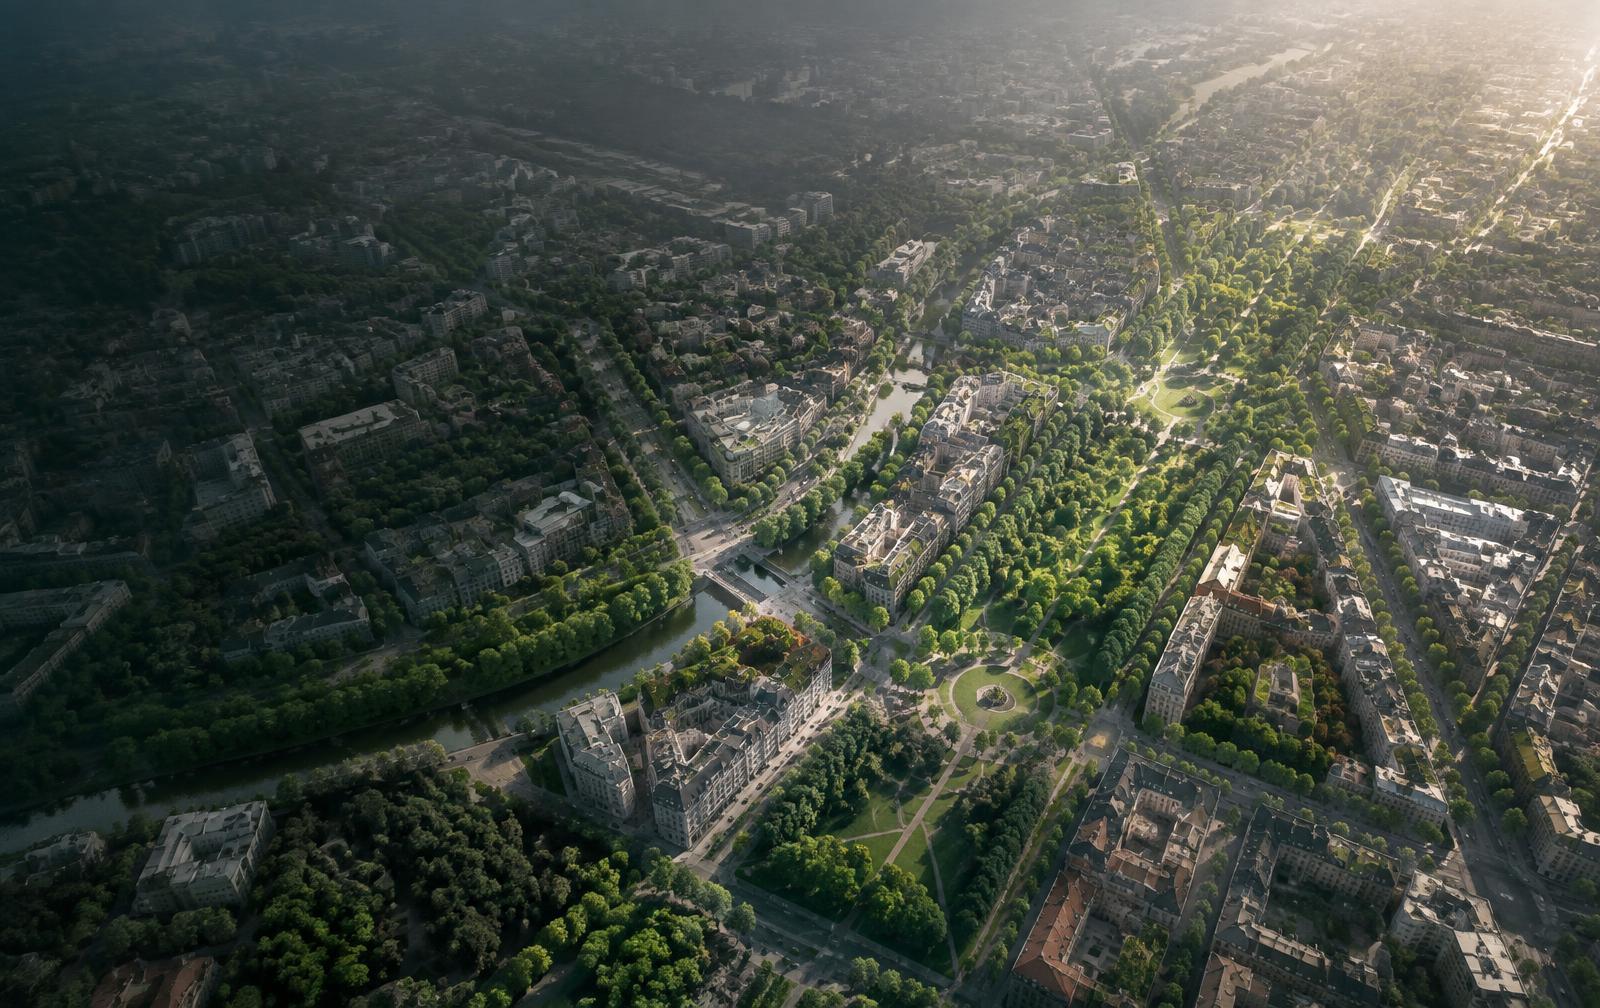
City report · Russia · Moscow Oblast
Khimki
Measured across a 2 km radius around Khimki, Moscow Oblast, Russia (12.57 km²)
- Tree cover
- 37.8%
- Air quality
- 47Good
- Trees in this area
- 119K
- More trees needed
- 0
- Area analyzed
- 12.57 km²
- Satellite image
- Sep 17, 2026
Khimki's tree count comes to 118,752 trees across 12.57 km² — already at or above the 30% tree-cover level considered healthy for this area. Air quality currently reads AQI 47 (Good): Air quality is satisfactory for everyone.
Tree cover detail
Healthy tree cover
37.8% tree cover against a 30% healthy-neighborhood target, across 12.57 km².
Trees in this area
118,752
Target trees
118,752
More trees needed
0
CO₂ if planted / yr
0 kg
Air quality detail
AQI 47Good
Observed Sep 27, 06:00 local time via Open-Meteo / CAMS, US EPA index. Values in µg/m³.
Health signal
Air quality is satisfactory for everyone.
PM2.5
11.3
PM10
13.8
NO₂
24.1
O₃
13.0
SO₂
7.1
CO
238.0
Frequently asked
Questions about Khimki
What is the tree count in Khimki?
Khimki has an estimated 118,752 trees across the 12.57 km² measured — 37.8% tree cover, already past the 30% tree-cover target set for this area.
How many more trees does Khimki need?
Khimki has already reached its tree-cover target, so no additional trees are needed to close the gap.
What is the air quality (AQI) in Khimki right now?
The latest reading for Khimki shows an AQI of 47 (Good), observed Sep 27, 06:00 local time via Open-Meteo / CAMS, US EPA index. Air quality is satisfactory for everyone.
How is Khimki's tree cover and air quality measured?
Tree cover is measured from Sentinel-2 L2A (ESA Copernicus) via Earth Search satellite imagery at 10 m detail across a 2 km radius around Khimki; the tree count is an estimate derived from that cover. Air-quality readings come from Open-Meteo / CAMS, US EPA index and may differ from street-level monitors.
See your own area
What does your neighborhood look like?
Pick any point and radius to get the same tree-cover and air-quality breakdown.
Check my address