City report · Golestan, Iran
Gonbad-e Kāvūs Air quality today
Air quality in Gonbad-e Kāvūs currently reads AQI 20 (Good): Air quality is satisfactory for everyone.
AQI 20
Air quality right now
Good
- PM2.5, fine particles (µg/m³)
- 3.4
- tree cover
- 3.3%
- trees in this area
- 10.4K
- more trees needed
- 83.9K
Measured across a 2 km radius around Gonbad-e Kavus, Golestan Province, Iran (12.57 km²), from a satellite image of Sep 22, 2026. Lower AQI is better: 0–50 is Good, above 300 is Hazardous.
Gonbad-e Kāvūs · AQI 20 (Good)
Gonbad-e Kāvūs's tree count comes to 10,367 trees across 12.57 km², 27 points below the 30% tree-cover level considered healthy for this area, so roughly 83,881 more trees would close the gap.
Air quality detail
Air quality in Gonbad-e Kāvūs today: AQI 20, Good
Main pollutant: PM2.5 · Observed Nov 11, 12:30 local time via Open-Meteo / CAMS, US EPA index. Values in µg/m³.
Model estimate · no ground station nearby
Health signal
Air quality is satisfactory for everyone.
PM2.5
3.4
PM10
5.0
NO₂
1.4
O₃
78.0
SO₂
0.6
CO
150.0
- Outdoor exercise
- A good day to be active outside
- Windows
- Open them to air the house
- Mask
- Not needed
- Air purifier
- Not needed
Over the last 7 days, the CAMS air-quality model put Gonbad-e Kāvūs's daily AQI at 45 on average, from 16 on Nov 9 to an hourly peak of 78 on Nov 6.
Where Gonbad-e Kāvūs stands: the most polluted cities in the world right now · the cleanest
Tree cover detail
Tree cover in Gonbad-e Kāvūs: Critically low
3.3% tree cover against a 30% healthy-neighborhood target, across 12.57 km².
Trees in this area
10,367
Target trees
94,248
More trees needed
83,881
CO₂ if planted / yr
1,845 t
Deforestation · 2001–2025
How much forest has Gonbad-e Kāvūs lost?
Since 2001, the area within 10 km of Gonbad-e Kāvūs has lost about 7 hectares of forest (about 10 football pitches): 6.3% of the forest it had in 2000. The biggest cause was farms, pasture and plantations (13%). About 1 hectare (16%) was deforestation: forest cleared for good for farms, mines or towns.
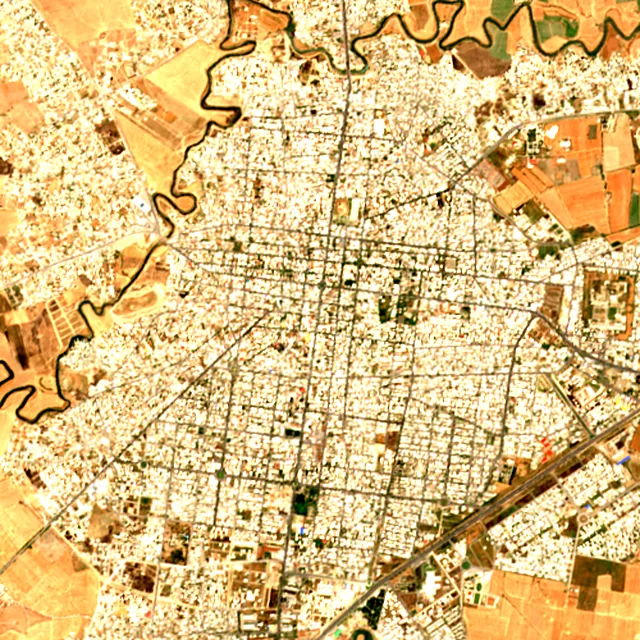
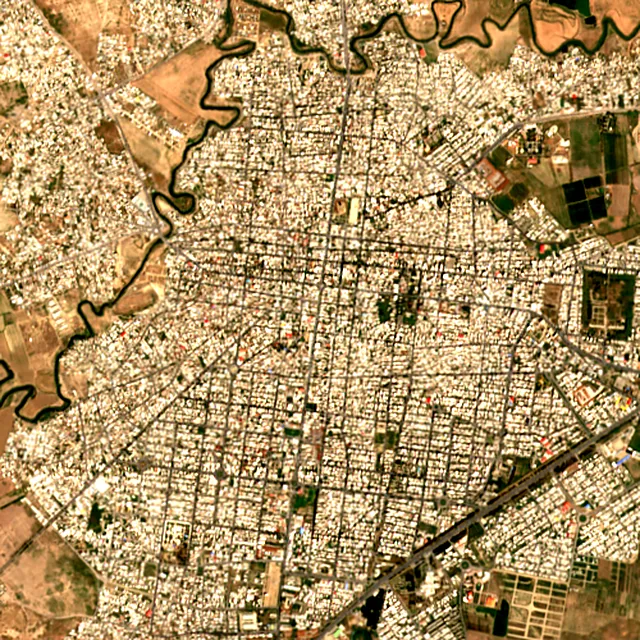

2017: satellite photo from June 2017 of a 5 × 5 km area in the city center.
- Forest lost since 2001
- 7 haabout 10 football pitches
- Share of its forest
- 6.3%of what there was in 2000
- Cleared for good
- 1 hadeforestation: turned into farms, mines or towns
The worst year was 2003, when about 2 hectares of forest were lost.
Hectares of forest lost each year
Show the figures as a table
| Year | Cleared for good | Can grow back | Total |
|---|---|---|---|
| 2001 | under 1 ha | 1 ha | 1 ha |
| 2002 | under 1 ha | 2 ha | 2 ha |
| 2003 | under 1 ha | 2 ha | 2 ha |
| 2004 | under 1 ha | under 1 ha | under 1 ha |
| 2005 | under 1 ha | under 1 ha | under 1 ha |
| 2006 | under 1 ha | under 1 ha | under 1 ha |
| 2007 | under 1 ha | under 1 ha | under 1 ha |
| 2008 | under 1 ha | under 1 ha | under 1 ha |
| 2009 | under 1 ha | under 1 ha | under 1 ha |
| 2010 | under 1 ha | under 1 ha | under 1 ha |
| 2011 | under 1 ha | under 1 ha | under 1 ha |
| 2012 | under 1 ha | under 1 ha | under 1 ha |
| 2013 | under 1 ha | under 1 ha | under 1 ha |
| 2014 | under 1 ha | under 1 ha | under 1 ha |
| 2015 | under 1 ha | under 1 ha | under 1 ha |
| 2016 | under 1 ha | under 1 ha | under 1 ha |
| 2017 | under 1 ha | under 1 ha | under 1 ha |
| 2018 | under 1 ha | under 1 ha | under 1 ha |
| 2019 | under 1 ha | under 1 ha | under 1 ha |
| 2020 | under 1 ha | under 1 ha | under 1 ha |
| 2021 | under 1 ha | under 1 ha | under 1 ha |
| 2022 | under 1 ha | under 1 ha | under 1 ha |
| 2023 | under 1 ha | under 1 ha | under 1 ha |
| 2024 | under 1 ha | under 1 ha | under 1 ha |
| 2025 | under 1 ha | under 1 ha | under 1 ha |
What is causing deforestation around Gonbad-e Kāvūs?
- Farms, pasture and plantationscleared for good13% · under 1 ha
- Towns and roadscleared for good4.4% · under 1 ha
- Unknown causescause unknown84% · 6 ha
Causes for 2025 are estimates, based on what caused forest loss in the same places up to 2024.
These figures cover everything within 10 km of the city center, a wider area than the report above, because forest is usually lost at a city's edges.
Source: Hansen/UMD/Google/USGS/NASA, Global Forest Change (GFC-2025-v1.13); causes: WRI/Google DeepMind drivers of forest loss; both CC BY 4.0, summed by Airleaf for each area. Images: contains modified Copernicus Sentinel data. How it's measured
In the same region
Measured cities near Gonbad-e Kāvūs
Same 2 km radius, same index — so they compare directly.
- Shahrud94.0 km
Iran
- Tree cover
- 5%
- Air quality
- 13
- Bojnūrd192.7 km
Iran
- Tree cover
- 4%
- Air quality
- 16
- Sari202.3 km
Iran
- Tree cover
- 8%
- Air quality
- 26
- Qā’em Shahr222.4 km
Iran
- Tree cover
- 10%
- Air quality
- 52
- Bābol234.5 km
Iran
- Tree cover
- 8%
- Air quality
- 69
Build your own
Compare Gonbad-e Kāvūs with anywhere
This place
Gonbad-e Kāvūs
Use this data
Put Gonbad-e Kāvūs's numbers on your site
Free to embed. Updates itself as the measurement refreshes.

Frequently asked
Questions about Gonbad-e Kāvūs
What is the air quality (AQI) in Gonbad-e Kāvūs right now?
The latest reading for Gonbad-e Kāvūs shows an AQI of 20 (Good), observed Nov 11, 12:30 local time via Open-Meteo / CAMS, US EPA index. The main pollutant is PM2.5. Air quality is satisfactory for everyone.
Is it safe to exercise outside in Gonbad-e Kāvūs today?
At AQI 20 (Good): a good day to be active outside. Windows: open them to air the house. Masks: not needed. The reading changes through the day, so check again before a long run or ride.
What has the air quality in Gonbad-e Kāvūs been like this week?
Over the last 7 days, the CAMS air-quality model put Gonbad-e Kāvūs's daily AQI at 45 on average, from 16 on Nov 9 to an hourly peak of 78 on Nov 6. No day averaged above 100, the level where the air turns unhealthy for sensitive groups.
How much forest has the area around Gonbad-e Kāvūs lost since 2001?
Since 2001, the area within 10 km of Gonbad-e Kāvūs has lost about 7 hectares of forest (about 10 football pitches): 6.3% of the forest it had in 2000. The biggest cause was farms, pasture and plantations (13%). About 1 hectare (16%) was deforestation: forest cleared for good for farms, mines or towns.
What is the tree count in Gonbad-e Kāvūs?
Gonbad-e Kāvūs has an estimated 10,367 trees across the 12.57 km² measured — 3.3% tree cover, 27 percentage points short of the 30% tree-cover target set for this area.
How many more trees does Gonbad-e Kāvūs need?
Gonbad-e Kāvūs needs roughly 83,881 more trees to close a 27-point shortfall against its 30% tree-cover target — about 1,845 t of extra CO₂ absorbed per year once grown.
How are Gonbad-e Kāvūs's air quality and tree cover measured?
Air quality comes from ground monitoring stations via OpenAQ where one reports nearby, and otherwise, as here, from the Open-Meteo / CAMS model, which may differ from street-level monitors. Tree cover is measured from Sentinel-2 L2A (ESA Copernicus) via Earth Search satellite imagery at 10 m detail across a 2 km radius around Gonbad-e Kavus; the tree count is an estimate derived from that cover.
See your own area
What does your neighborhood look like?
Pick any point and radius to get the same air-quality and tree-cover breakdown.
Check my address