Deforestation · 10 km around the city · 2001–2025
Deforestation around Hải Châu
Since 2001, the area within 10 km of Hải Châu has lost about 517 hectares of forest (about 720 football pitches): 15% of the forest it had in 2000. Most of it was lost to logging, so much of it can grow back. About 119 hectares (23%) was deforestation: forest cleared for good for farms, mines or towns.
- hectares of forest in 2000
- 3,510
- within 10 km of the center
- hectares of forest lost since 2001
- 517
- 15% of it, about 720 football pitches
- hectares cleared for good
- 119
- deforestation, 23% of the loss
- worst year
- 2012
- 63 ha lost
A hectare is 100 by 100 meters, a bit bigger than a football pitch. From satellite maps by the University of Maryland, added up by Airleaf. Data from .
Around Hải Châu · 517 hectares of forest lost since 2001
Satellite timelapse
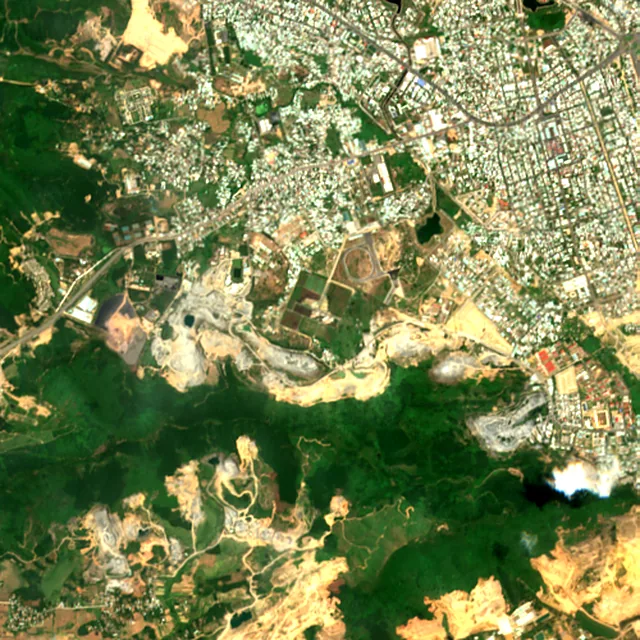
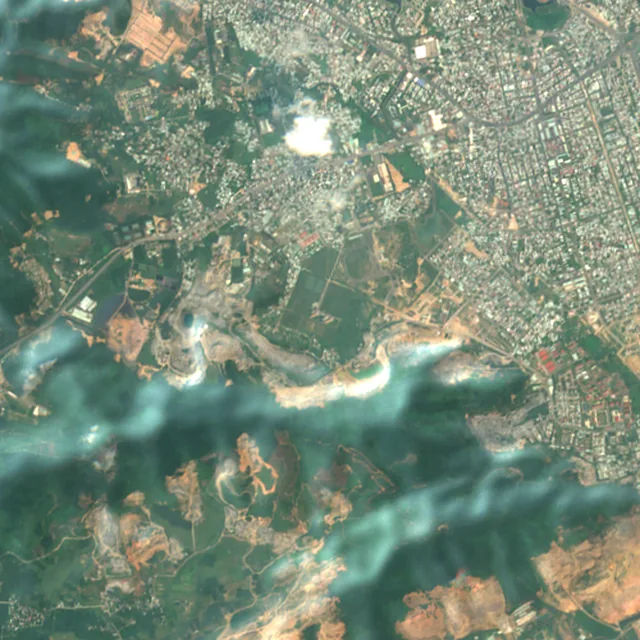
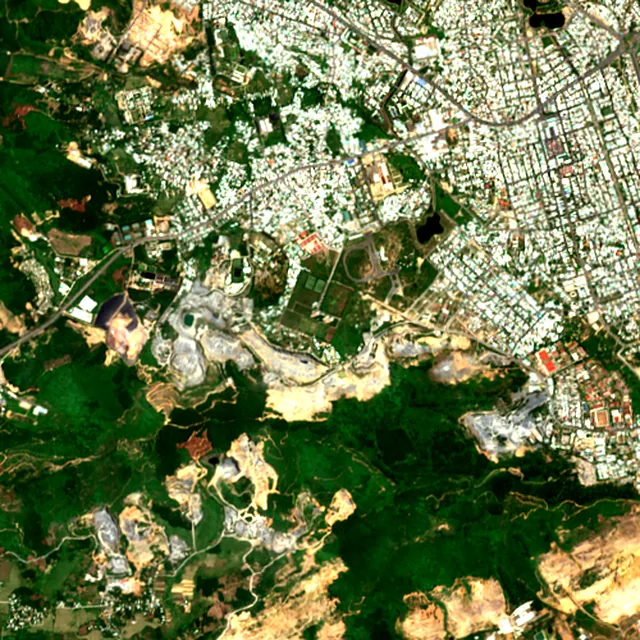
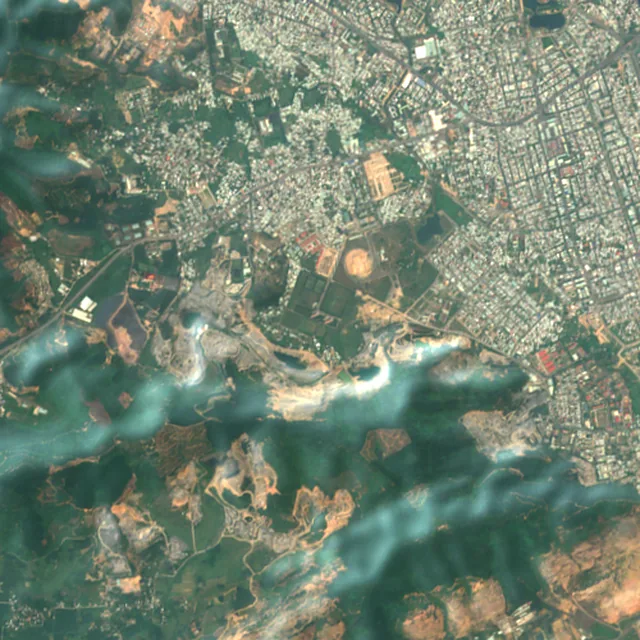
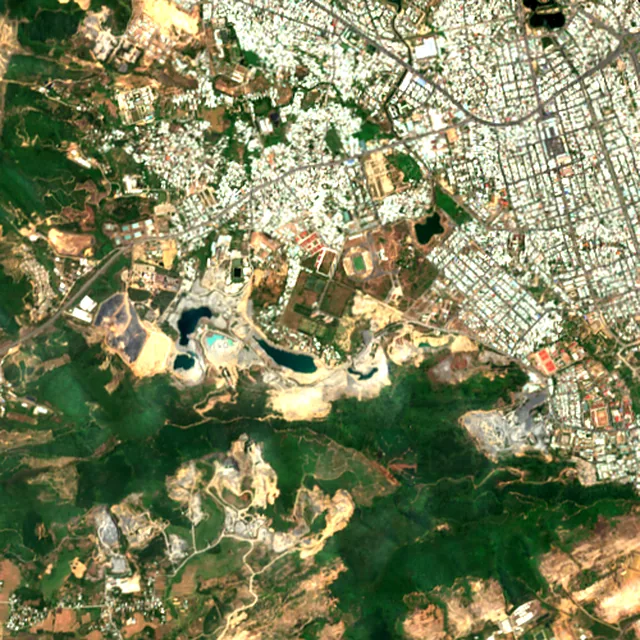
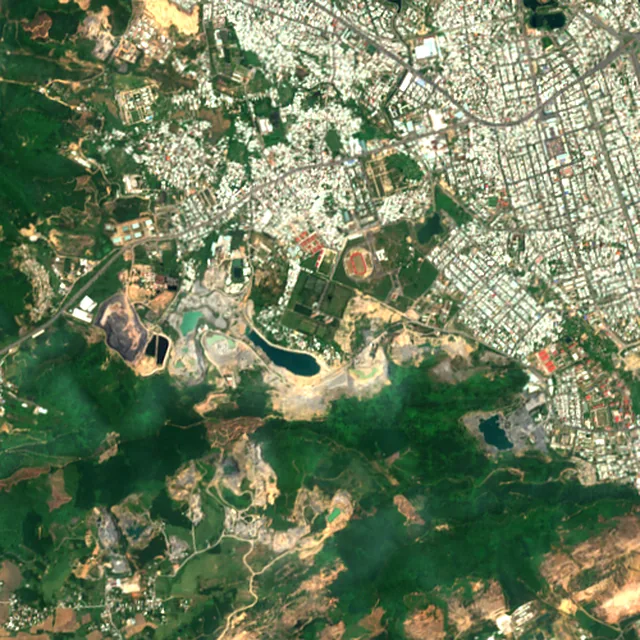
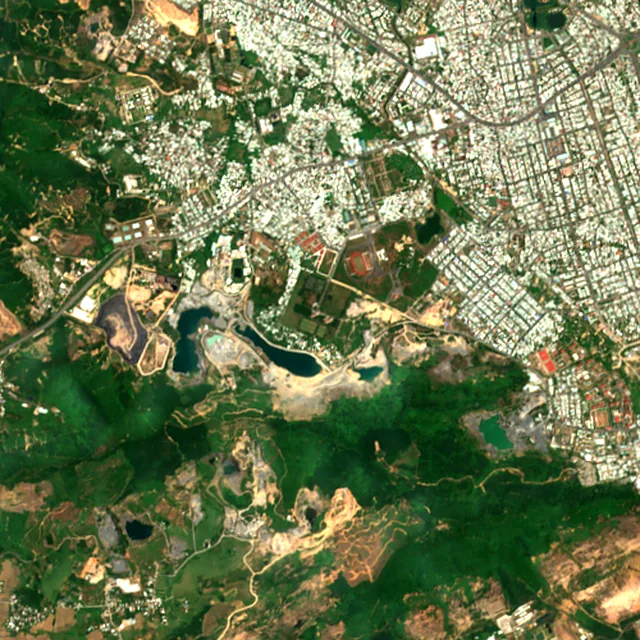
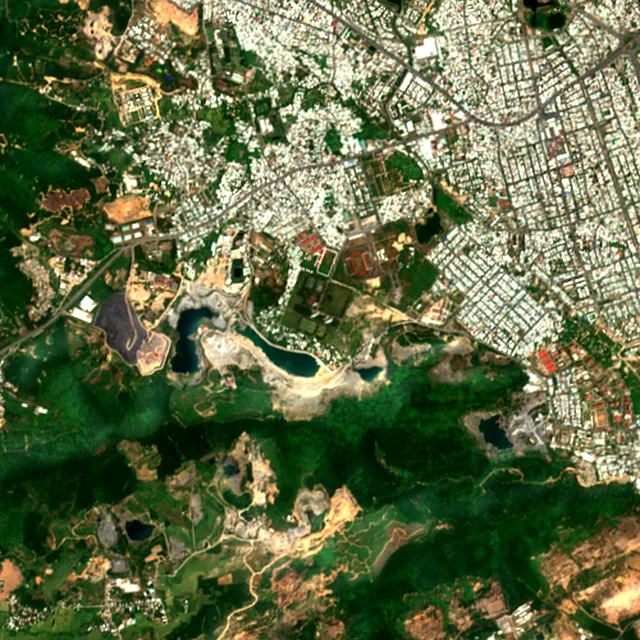
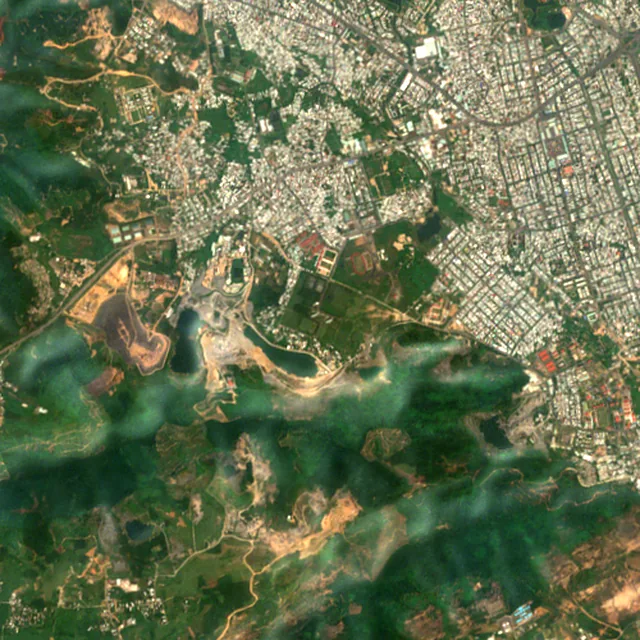
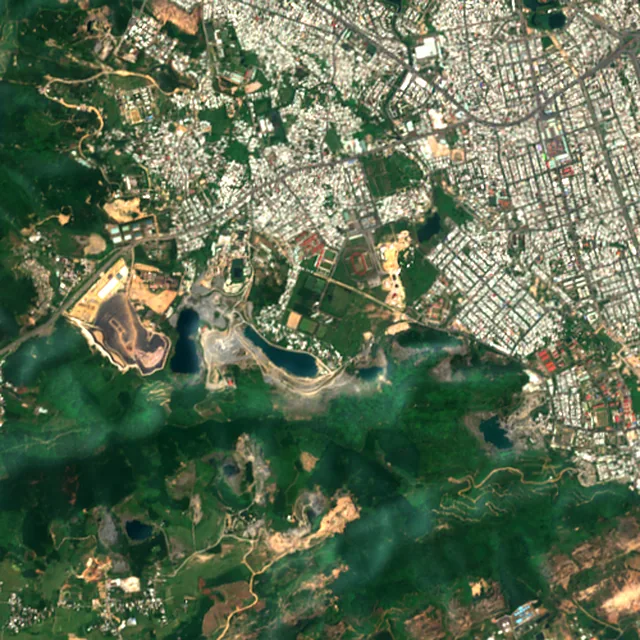

2017: satellite photo from May 2017 of a 5 × 5 km area about 7 km west of the city center.
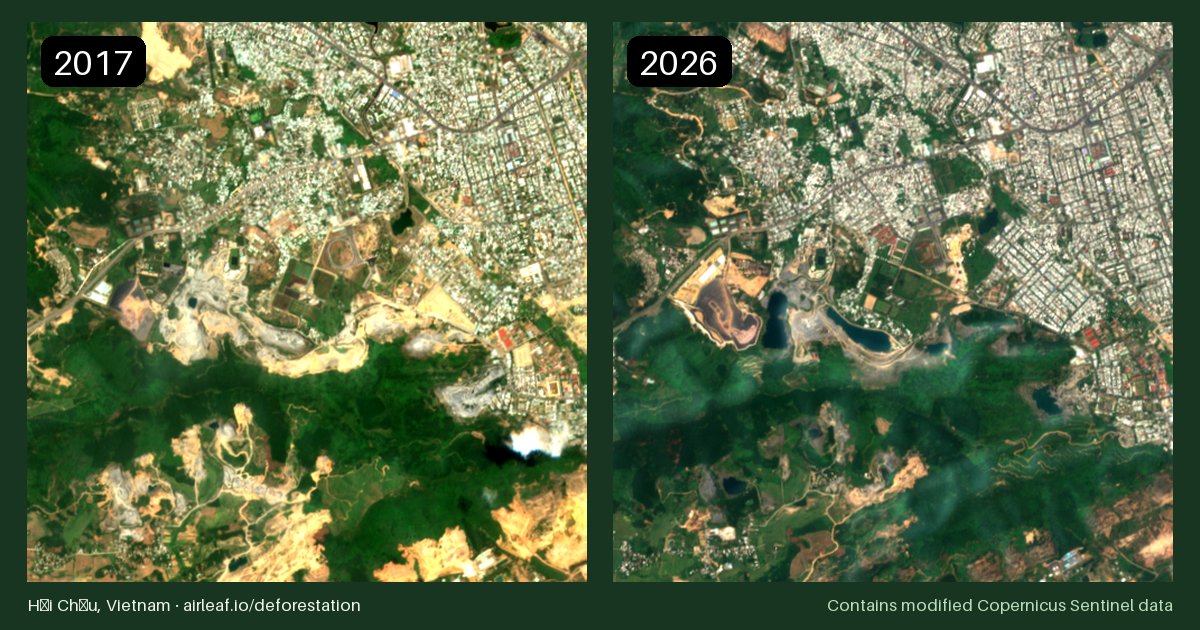
Satellite photos of the same 5 × 5 km area, one per year, all taken in the same season so the colors compare. You can see forest being cleared and towns spreading, though not single trees. Download the before/after image (free to reuse with credit to Airleaf).
Year by year
Forest lost around Hải Châu, year by year
The worst year was 2012, when about 63 hectares of forest were lost.
Hectares of forest lost each year
Show the figures as a table
| Year | Cleared for good | Can grow back | Total |
|---|---|---|---|
| 2001 | under 1 ha | under 1 ha | under 1 ha |
| 2002 | under 1 ha | 1 ha | 2 ha |
| 2003 | 2 ha | 3 ha | 4 ha |
| 2004 | 6 ha | 3 ha | 9 ha |
| 2005 | 11 ha | 32 ha | 43 ha |
| 2006 | 11 ha | 44 ha | 55 ha |
| 2007 | 4 ha | 3 ha | 7 ha |
| 2008 | under 1 ha | 1 ha | 2 ha |
| 2009 | 9 ha | 5 ha | 14 ha |
| 2010 | under 1 ha | under 1 ha | under 1 ha |
| 2011 | 7 ha | 8 ha | 15 ha |
| 2012 | 16 ha | 48 ha | 63 ha |
| 2013 | 3 ha | 16 ha | 20 ha |
| 2014 | 6 ha | 32 ha | 38 ha |
| 2015 | 4 ha | 7 ha | 11 ha |
| 2016 | 6 ha | 23 ha | 29 ha |
| 2017 | 16 ha | 8 ha | 24 ha |
| 2018 | 2 ha | 20 ha | 22 ha |
| 2019 | 4 ha | 24 ha | 27 ha |
| 2020 | 3 ha | 28 ha | 31 ha |
| 2021 | 1 ha | 12 ha | 13 ha |
| 2022 | 2 ha | 24 ha | 26 ha |
| 2023 | under 1 ha | 19 ha | 20 ha |
| 2024 | 4 ha | 13 ha | 17 ha |
| 2025 | 3 ha | 26 ha | 28 ha |
Forest gained and lost, 2000–2020
- Forest in 2000
- 4,830 ha
- Forest in 2020
- 4,440 ha
- Overall change
- −394 haless forest than in 2000
Comparing satellite maps from 2000 and 2020, the forest around Hải Châu shrank from about 4,830 hectares to 4,440 hectares, a net loss of about 394 hectares (−8.2%). New forest grew on about 159 hectares, but 553 hectares were lost.
These 2000 and 2020 maps, from the University of Maryland, count any land with trees taller than 5 m as forest, including plantations and orchards. Forest that was cut or burned and had grown back by 2020 counts in both years, so the loss here is smaller than the yearly figures.
Causes
What is causing deforestation around Hải Châu?
- 23%cleared for good (deforestation)
- 76%can grow back (fire, logging, storms)
- 1.3%cause unknown
- Logging74% · 383 ha
Can grow back. Trees cut for timber or paper. The land usually stays forest and grows back.
- Towns and roads14% · 74 ha
Cleared for good. Forest replaced by houses, buildings and roads.
- Farms, pasture and plantations8.6% · 45 ha
Cleared for good. Forest cleared for crops, cattle pasture or tree plantations: the biggest cause of deforestation in the world.
- Unknown causes1.3% · 7 ha
Cause unknown. The satellites saw the trees go, but not why.
Also, each under 1%: storms, floods and other natural causes, shifting farming.
Causes for 2025 are estimates, based on what caused forest loss in the same places up to 2024.
Nearby cities losing forest
Use this data
Put Hải Châu's forest loss on your site
Free to embed, with a link back to the full figures.
Frequently asked
Questions about deforestation around Hải Châu
How much forest has Hải Châu lost since 2001?
Since 2001, the area within 10 km of Hải Châu has lost about 517 hectares of forest (about 720 football pitches): 15% of the forest it had in 2000. Most of it was lost to logging, so much of it can grow back. About 119 hectares (23%) was deforestation: forest cleared for good for farms, mines or towns.
What is causing deforestation around Hải Châu?
The main causes of forest loss since 2001 are logging (74%), towns and roads (14%), farms, pasture and plantations (8.6%). About 119 hectares was deforestation, meaning forest cleared for good for farms, mines or towns. Causes for 2025 are estimates, based on what caused forest loss in the same places up to 2024.
What was the worst year for forest loss around Hải Châu?
The worst year was 2012, when about 63 hectares of forest were lost.
Is the forest around Hải Châu growing or shrinking?
Comparing satellite maps from 2000 and 2020, the forest around Hải Châu shrank from about 4,830 hectares to 4,440 hectares, a net loss of about 394 hectares (−8.2%). New forest grew on about 159 hectares, but 553 hectares were lost. These 2000 and 2020 maps, from the University of Maryland, count any land with trees taller than 5 m as forest, including plantations and orchards. Forest that was cut or burned and had grown back by 2020 counts in both years, so the loss here is smaller than the yearly figures.
Can I see satellite images of Hải Châu over the years?
Yes. The timelapse at the top of this page has a satellite photo for every year from 2017 to 2026 of a 5 × 5 km area near Hải Châu, where the most forest was lost. Press play to watch it change, or turn on "Show cleared forest" to see exactly where trees were lost.
How is forest loss measured?
We use satellite maps from the University of Maryland (Hansen and colleagues) that show, for every 30 × 30 m patch of land on Earth, the year its trees were cut down, burned or died, from 2001 to 2025. We add up those patches within 10 km of the center of Hải Châu, counting only places that were at least 30% covered by trees in 2000. The cause of each loss comes from a map made by the World Resources Institute and Google DeepMind. All figures are estimates.