Air quality comparison · Malaysia, 28 km apart
Bandar Tasik Puteri vs Klang Air quality index (AQI) today
Bandar Tasik Puteri has cleaner air than Klang right now: AQI 66 (Moderate) against 86 (Moderate).
Both sit in the same EPA band, so the health advice is the same for each today. Over the past 6 days, on modeled daily averages, both averaged AQI 88. Bandar Tasik Puteri has lost more forest since 2001. Bandar Tasik Puteri has more tree cover.
Malaysia
AQI 66
Moderate
Cleaner right now
- PM2.5
- 16.9 µg/m³1.1× WHO guideline
- Main pollutant
- PM2.5
- Source
- Ground station
- Reading
- Nov 11, 23:00 local
Malaysia
AQI 86
Moderate
Cleaner right now
- PM2.5
- 27.8 µg/m³1.9× WHO guideline
- Main pollutant
- PM2.5
- Source
- Ground station
- Reading
- Nov 11, 23:00 local
Updated . Lower is better on the US EPA index: 0–50 is Good, above 300 is Hazardous. Measured by Airleaf.
Bandar Tasik Puteri66Klang86
Head to head
Bandar Tasik Puteri vs Klang at a glance
Bandar Tasik Puteri is ahead on 4 of 6 measures, and Klang on 1. The better figure in each row is marked.
| Bandar Tasik Puteri | Klang | |
|---|---|---|
| Air quality nowUS AQI. Lower is better. | 66 (better) | 86 |
| PM2.5Fine particles, µg/m³. | 16.9 (better) | 27.8 |
| Past week's averageUS AQI, 6 days. | 88 | 88 |
| Forest lost since 2001Within 10 km of the center. | 13,300 ha | 5,140 ha (better) |
| Tree coverWithin 2 km of the center. | 54.2% (better) | 23.3% |
| Trees still neededTo reach a healthy canopy. | 0 (better) | 20.6K |
Air quality today
What is the air like in Bandar Tasik Puteri and Klang right now?
Bandar Tasik Puteri has cleaner air than Klang right now: AQI 66 (Moderate) against 86 (Moderate). PM2.5 is setting the index in both.
Bandar Tasik Puteri's PM2.5 is about 1.1× the WHO's 24-hour guideline of 15 µg/m³. Klang's PM2.5 is about 1.9× the WHO's 24-hour guideline of 15 µg/m³.
Both readings come from nearby ground stations.
Bandar Tasik PuteriKlang
Concentrations at the same moment as the index above, for the pollutants both places report. Lower is better. The dark marks on the PM2.5 and PM10 rows show the WHO's 24-hour guidelines (15 and 45 µg/m³).
Bandar Tasik Puteri: Ground station · Shah Alam, Selangor, Malaysia, 22.1 km away · median of 4 stations. Data: World Air Quality Index Project, Malaysia Department of Environment (DOE); Air Polluant Index Management System.
Klang: Ground station · Pelabuhan Kelang, Selangor, Malaysia, 4.1 km away. Data: World Air Quality Index Project, Malaysia Department of Environment (DOE); Air Polluant Index Management System.
The past week
Which had cleaner air over the past 6 days?
Over the past 6 days, on modeled daily averages, both averaged AQI 88. The two are close enough that the air model behind these daily figures barely separates them, so their lines nearly overlap.
- Cleaner days
- Bandar Tasik Puteri0Klang1
- Average AQI
- Bandar Tasik Puteri88Klang88
- Worst day, AQI
- Bandar Tasik Puteri94Klang92
The daily numbers (6 days)
| Day | Bandar Tasik Puteri | Klang |
|---|---|---|
| Nov 5 | 92 | 92 |
| Nov 6 | 90 | 90 |
| Nov 7 | 83 | 83 |
| Nov 8 | 87 | 87 |
| Nov 9 | 83 | 83 |
| Nov 10 | 94 | 91 |
Daily averages from the CAMS atmospheric model for both places, so the week compares like with like. They can differ from today's reading at the top of the page wherever that comes from a ground station.
What it means today
Is it safe to go outside in Bandar Tasik Puteri and Klang today?
Unusually sensitive people should consider limiting long outdoor exertion. Both are in the same EPA band today (Moderate), so the advice is the same.
Exercise outdoors
Fine for most people; unusually sensitive people should take long or hard exercise easier.
Windows
Fine to open; close them if you are sensitive to pollution.
Masks
Not needed for most people.
Air purifier
Worth running if you are sensitive.
Against everywhere else
How do Bandar Tasik Puteri and Klang compare with the rest of the world?
Right now Bandar Tasik Puteri's air is cleaner than 41% of the 5,420 places Airleaf tracks, and Klang's is cleaner than 28%. Within Malaysia, that is 33% and 5% of its 56 measured places.
Cleaner air than…
- Bandar Tasik Puteri
- Beats 41%
- Klang
- Beats 28%
More tree cover than…
- Bandar Tasik Puteri
- Beats 94%
- Klang
- Beats 54%
Includes model estimates as well as station readings, so it can differ from our most polluted and cleanest air rankings, which use station readings only.
Deforestation · 2001–2025
Which has lost more forest, Bandar Tasik Puteri or Klang?
Bandar Tasik Puteri has lost more: about 13,300 ha of forest within 10 km of its center from 2001 to 2025, against 5,140 ha around Klang. 13,200 ha of that was cleared for good, for farms, mines or towns.
Measured within 10 km of each center, from the yearly satellite maps of forest loss: a wider circle than the one for tree cover, because forest is usually lost at a city's edges.
Worst year: 2004, with 1,190 ha lost.
Worst year: 2004, with 550 ha lost.
| Bandar Tasik Puteri | Klang | |
|---|---|---|
| Forest lost since 2001Cleared, burned or logged. | 13,300 ha | 5,140 ha (better) |
| Share of its forestOf what it had in 2000. | 62% | 47% (better) |
| Cleared for goodTurned into farms, mines or towns. | 13,200 ha | 5,130 ha (better) |
| Recent trend2021–2025 against the five years before. | Slowing down | Slowing down |
| Main known cause | Farms, pasture and plantations (48%) | Towns and roads (84%) |
Satellite timelapses
Watch both change, year by year
A clear satellite photo a year of the land around each city. Press play, turn on the forest cleared since the first year, or drag the before and after.
Bandar Tasik Puteri
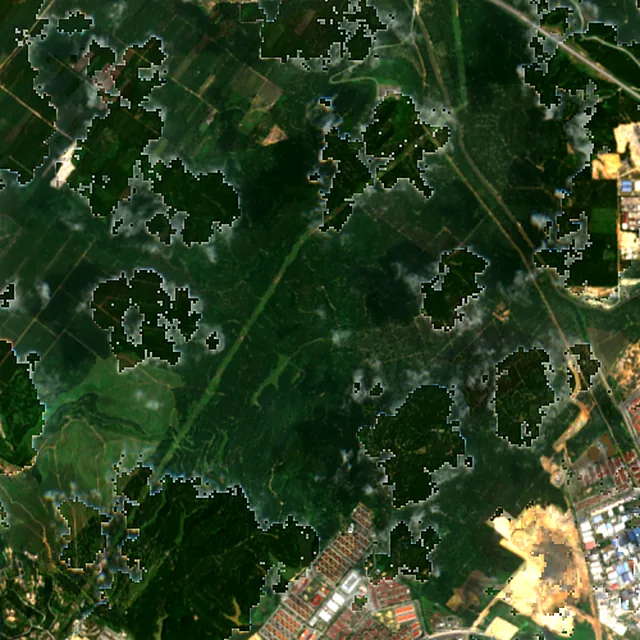
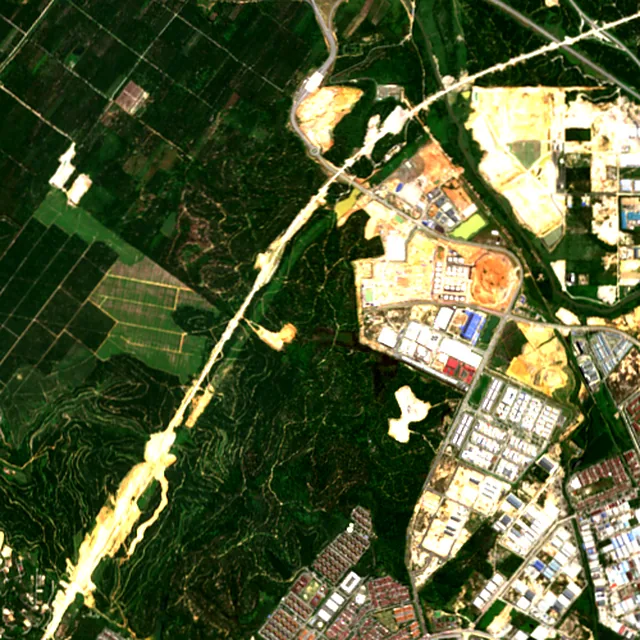

2017: satellite photo from March 2017 of a 5 × 5 km area about 6 km west of the city center.
Klang
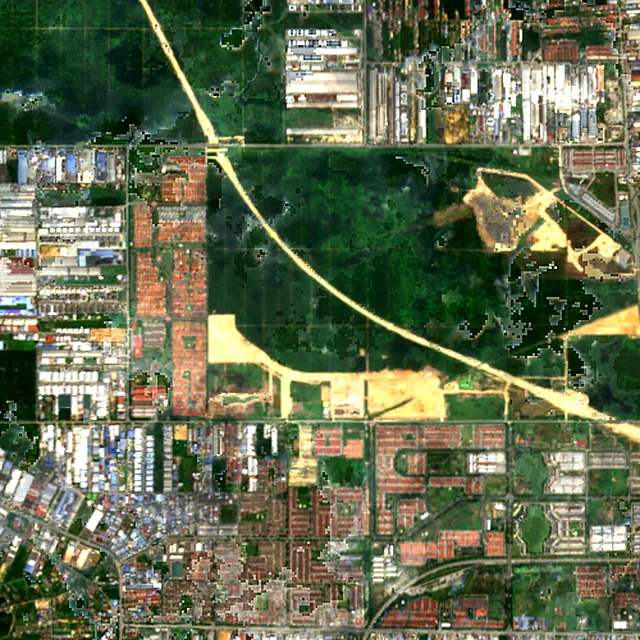
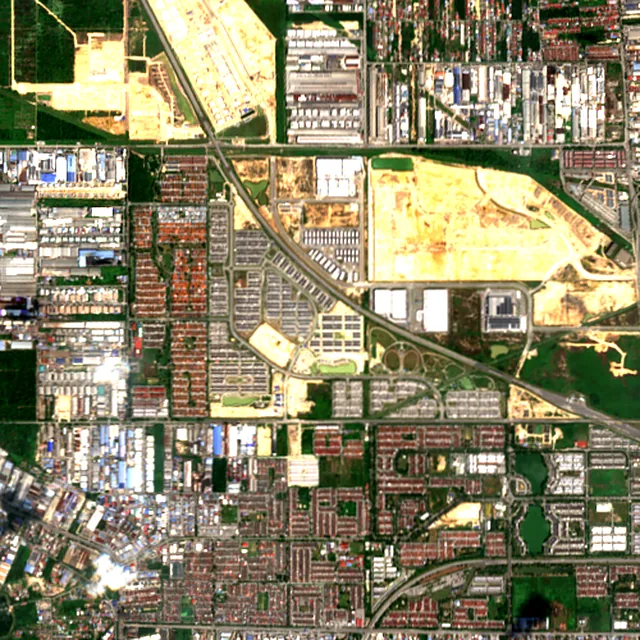
2017: satellite photo from February 2017 of a 5 × 5 km area about 7 km north of the city center.
Trees
Which has more trees, Bandar Tasik Puteri or Klang?
Bandar Tasik Puteri has more tree cover: 54.2% of the land within 2 km of its center against 23.3% around Klang, or about 170,274 trees against 71,662.
The dark mark is each place's canopy target: 30% of the land, raised where air quality is poor.
| Bandar Tasik Puteri | Klang | |
|---|---|---|
| Trees standingEstimated from the canopy area. | 170K (better) | 71.7K |
| Trees still neededTo reach the target. Fewer is better. | 0 (better) | 20.6K |
| CO₂ absorbed each yearBy the trees already standing. | 3.7M kg (better) | 1.6M kg |
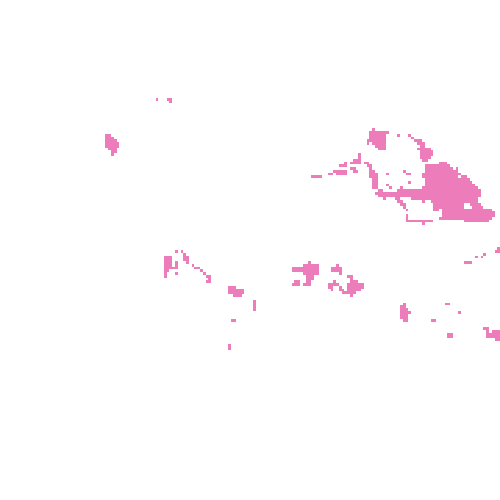
Tree cover on the satellite image
The same 2 km radius around each center, with the tree cover the satellite found marked on it.
Reading these numbers
How this comparison is made
Air quality index
The US EPA index, computed from current pollutant concentrations: ground stations where a place has them nearby, and the CAMS atmospheric model everywhere else. It moves hour to hour, so it is a snapshot rather than a verdict on either place. The guideline marks are from the WHO's 2021 air quality guidelines.
Trees and forest
Tree cover is the share of ground under canopy within 2 km of each center, read from Sentinel-2 satellite imagery at 10 m detail. It measures that circle, not the whole municipality, which is what makes the two comparable. Forest loss comes from the University of Maryland's Global Forest Change maps.
More on the method on the About Airleaf page.
Frequently asked
Bandar Tasik Puteri vs Klang: your questions answered
Is Bandar Tasik Puteri cleaner than Klang?
On air quality, yes, right now: Bandar Tasik Puteri reads AQI 66 against 86, a gap of 20 points on the US EPA index. This is a live reading rather than an annual average, so it can reverse within a day. Over the past 6 days, on modeled daily averages, both averaged AQI 88.
Is it safe to exercise outdoors in Bandar Tasik Puteri and Klang today?
The advice is the same for both today. Unusually sensitive people should consider limiting long outdoor exertion. Bandar Tasik Puteri reads AQI 66 and Klang reads AQI 86.
Which has lost more forest, Bandar Tasik Puteri or Klang?
Bandar Tasik Puteri has lost more: about 13,300 ha of forest within 10 km of its center from 2001 to 2025, against 5,140 ha around Klang. 13,200 ha of that was cleared for good, for farms, mines or towns.
Which has more trees, Bandar Tasik Puteri or Klang?
Bandar Tasik Puteri has more tree cover: 54.2% of the land within 2 km of its center against 23.3% around Klang, or about 170,274 trees against 71,662. Both figures describe the same-sized circle of ground around each center, not the whole municipality.
How many more trees do Bandar Tasik Puteri and Klang need?
Bandar Tasik Puteri needs about 0 more to reach its canopy target of 30%, and Klang about 20,607 to reach 30%. The target starts at 30% of the land and rises where air quality is poor.
Why can two places 28 km apart read differently?
Air changes over short distances with traffic, industry, wind and hills, and each reading comes from the nearest ground stations or, where there are none, from a regional model. A gap of a few points between neighbors is within normal variation, while a gap that crosses an EPA band is worth noticing.
Are Bandar Tasik Puteri and Klang measured the same way?
The method is the same: the US EPA index for air, and Sentinel-2 satellite imagery at 10 m detail over an identical radius for trees. Both readings come from nearby ground stations. Nothing is adjusted for population, city limits or climate.
How often does the Bandar Tasik Puteri vs Klang comparison update?
The air readings refresh about once an hour, and each reading's local time is shown at the top of the page. Tree cover comes from the latest clear satellite image of each area (Sep 4, 2026 and Aug 15, 2026), and the forest figures are published yearly.
Keep going
Compare them with somewhere else
- Bandar Tasik Puteri vs Kuala LumpurAQI 66AQI 68Compare
- Bandar Tasik Puteri vs KaparAQI 66AQI 68Compare
- Bandar Tasik Puteri vs Kampung Baru SubangAQI 66AQI 66Compare
- Bandar Tasik Puteri vs Bukit Rahman PutraAQI 66AQI 63Compare
- Bandar Tasik Puteri vs Bukit JalilAQI 66AQI 83Compare
- Bandar Tasik Puteri vs Selayang Baru UtaraAQI 66AQI 113Compare
Build your own
Compare Bandar Tasik Puteri with somewhere else
This place
Bandar Tasik Puteri